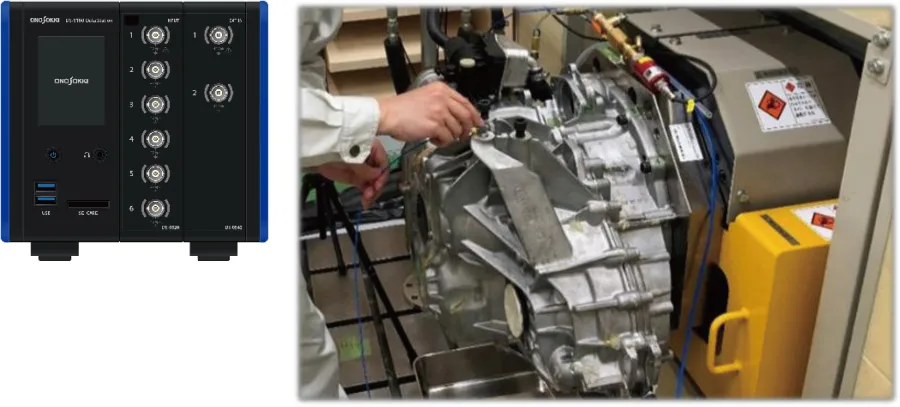
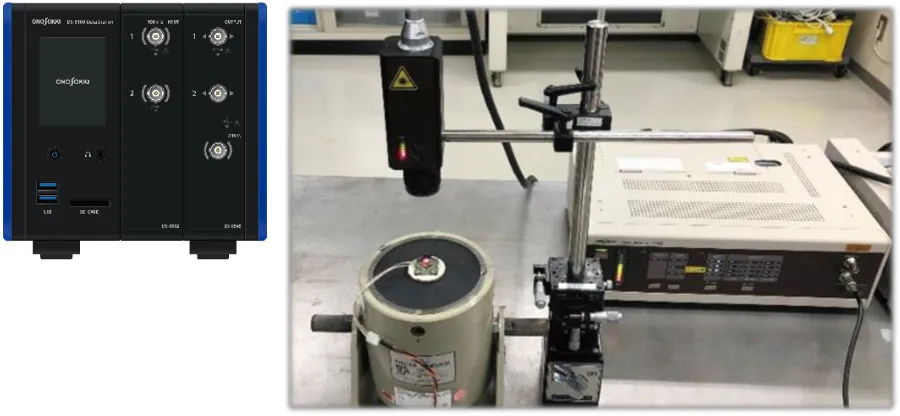
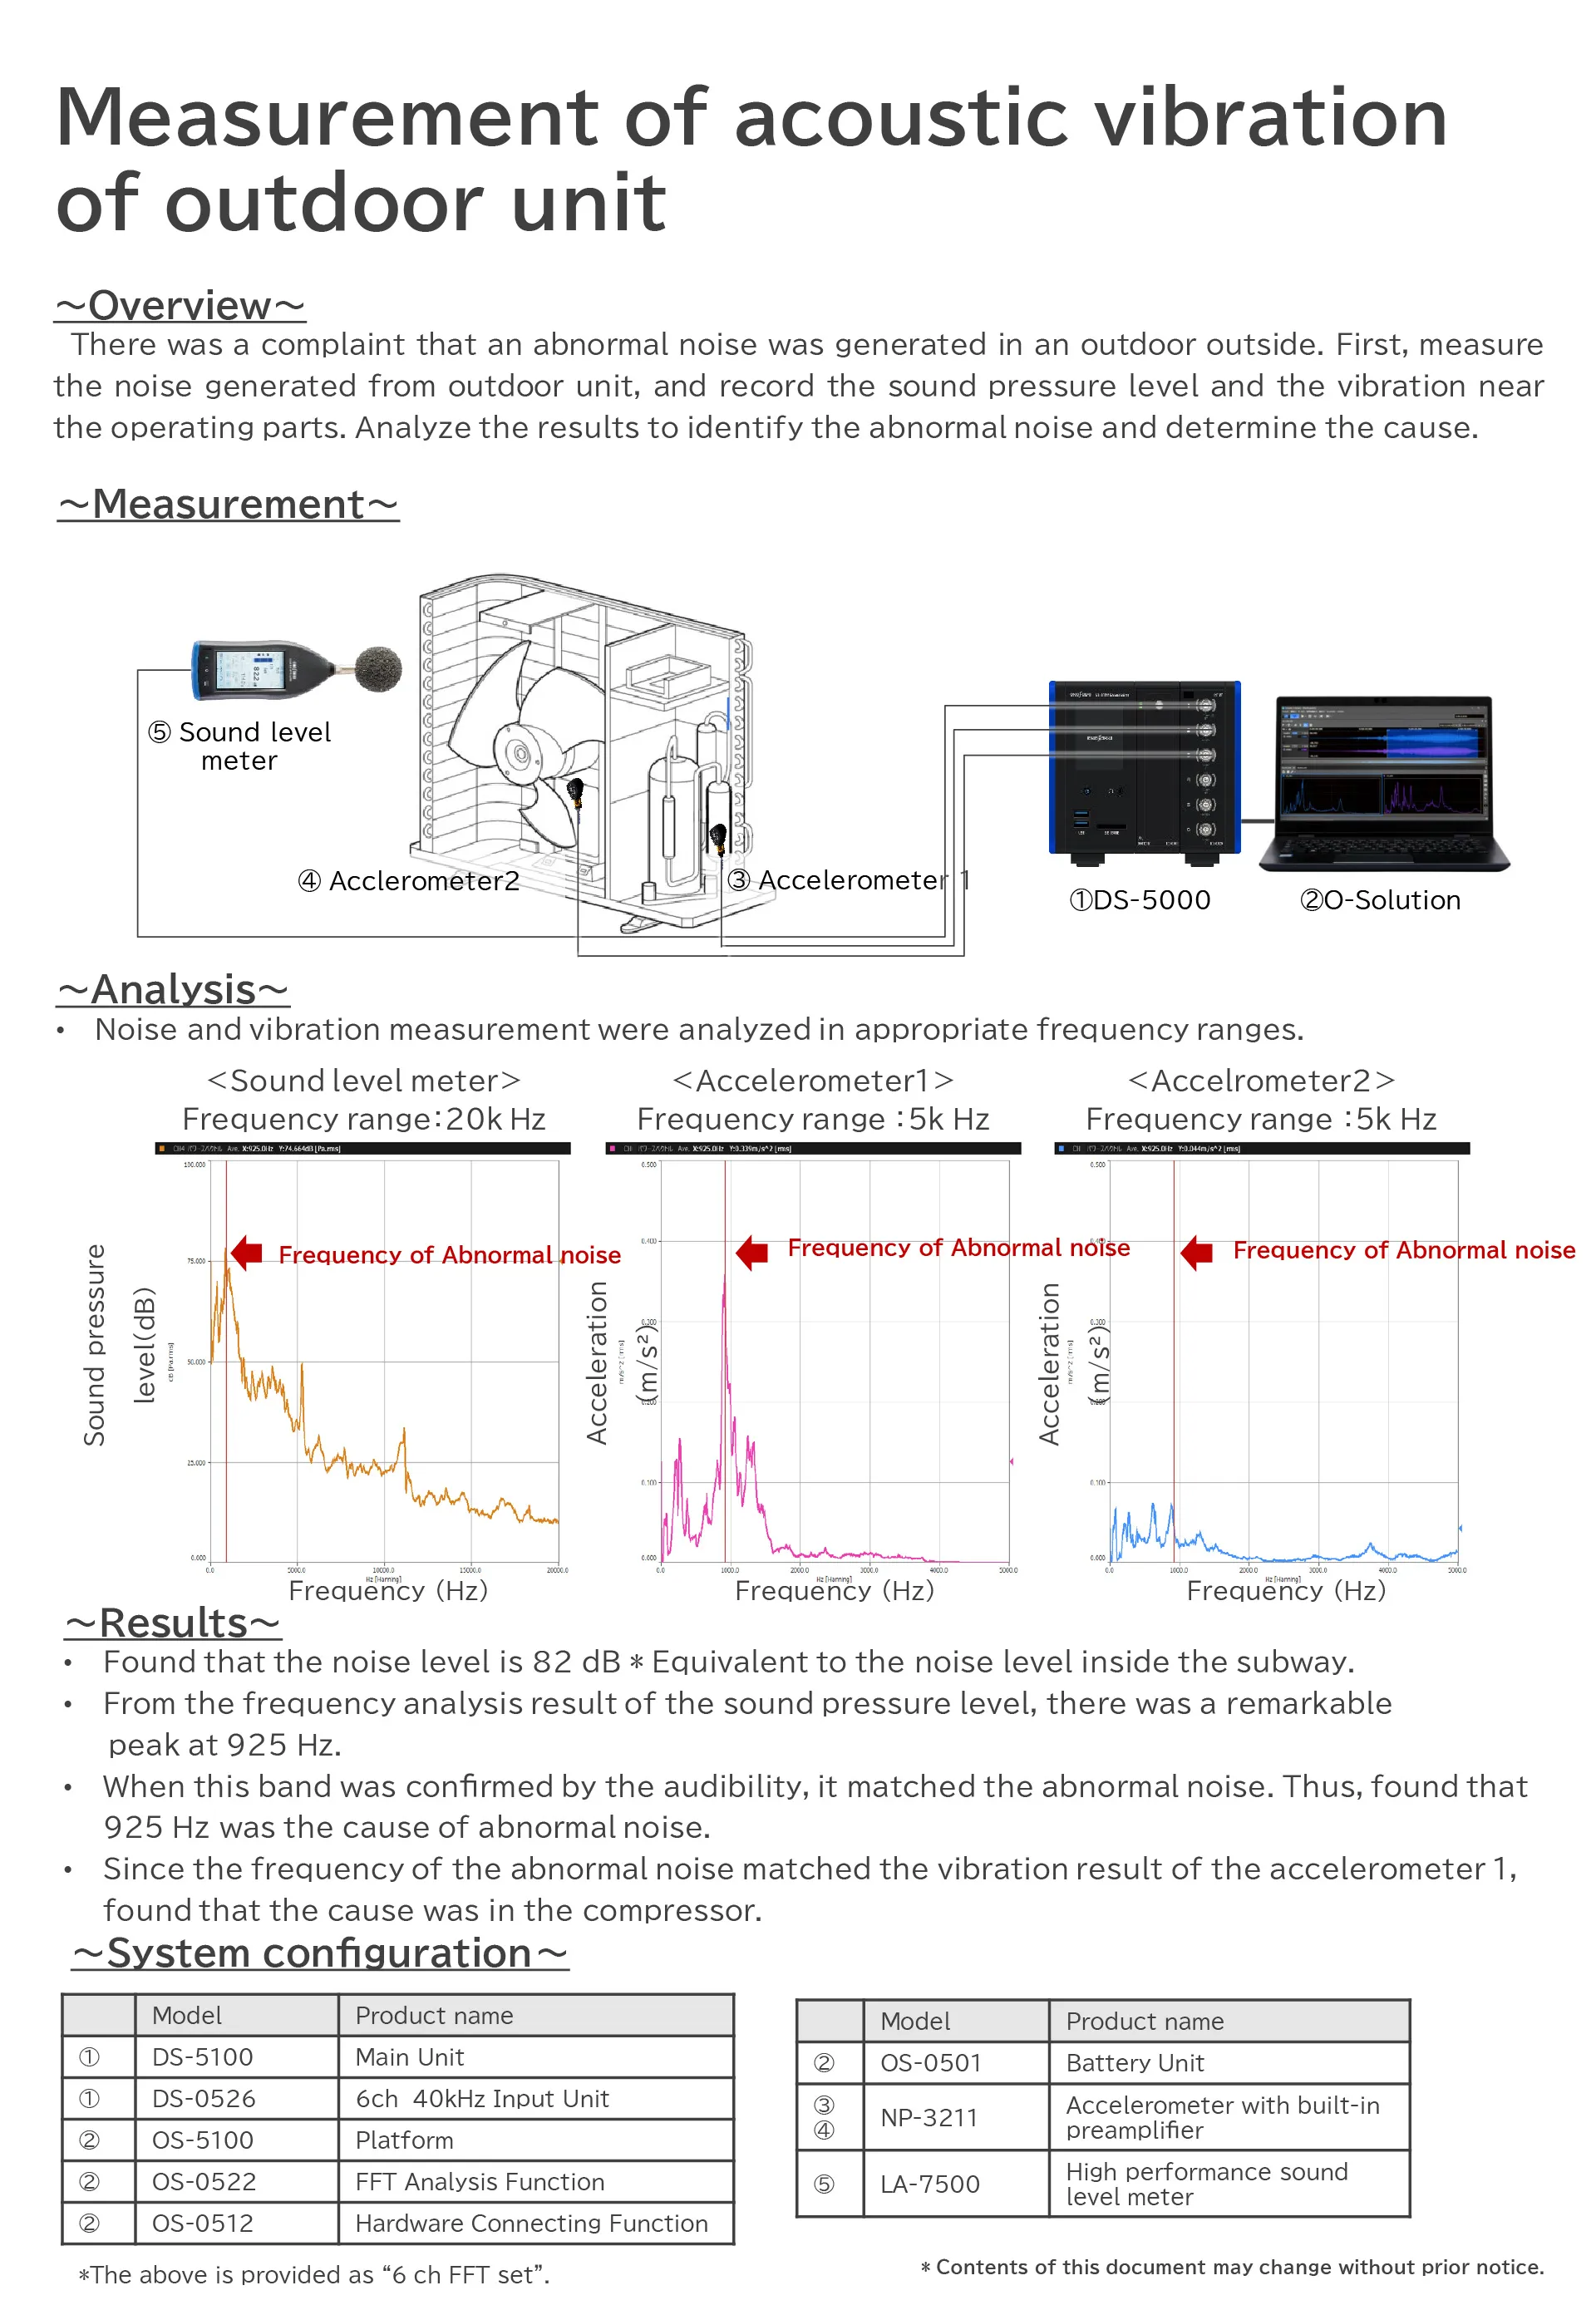
Sound and Vibration Analysis system
O-Solution DS-5000
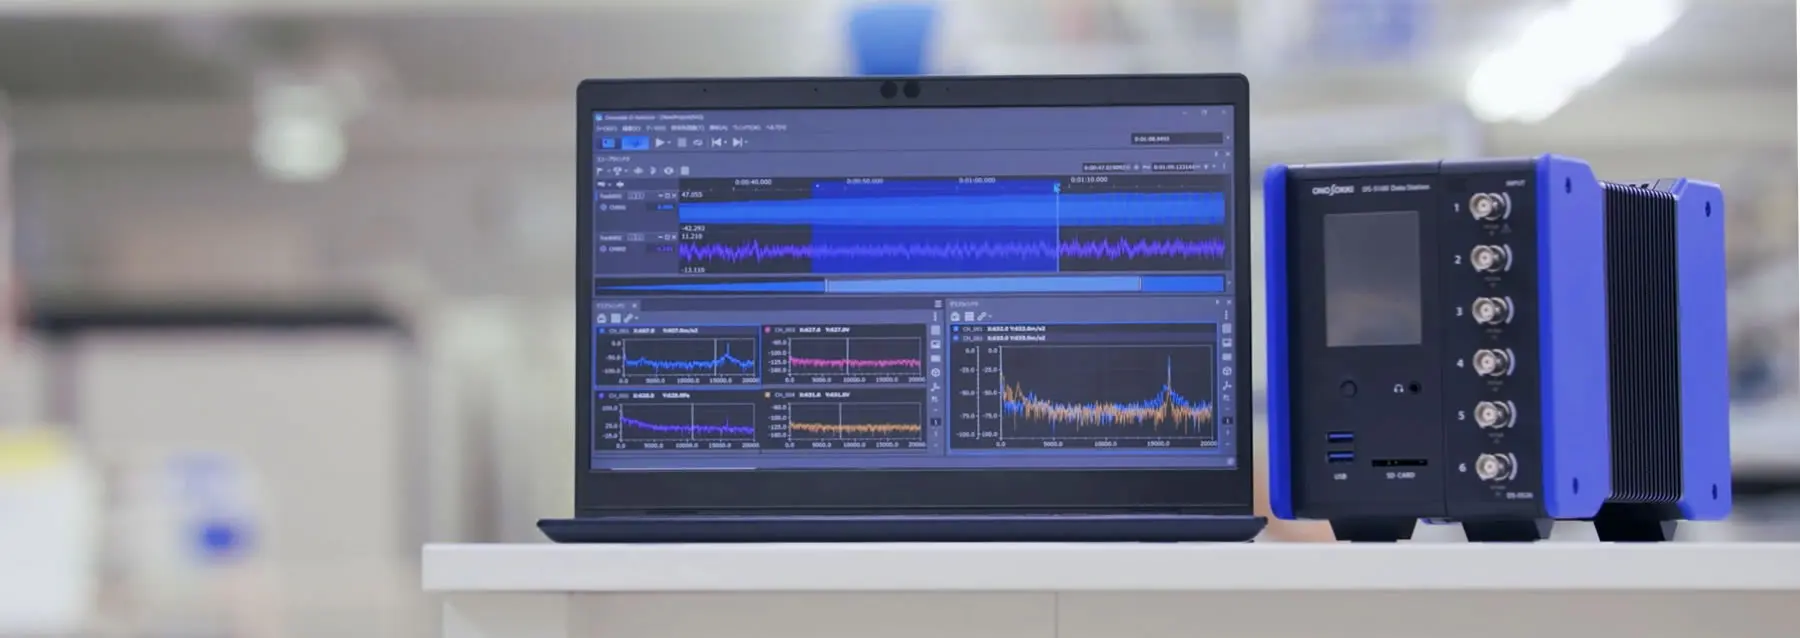
With the concept of "Quickly, Easily, and Anywhere", developed by utilizing the digital signal processing technology that we have cultivated over 40 years and the voices of customers in various fields.
Achieves highly accurate measurement and analysis
Software
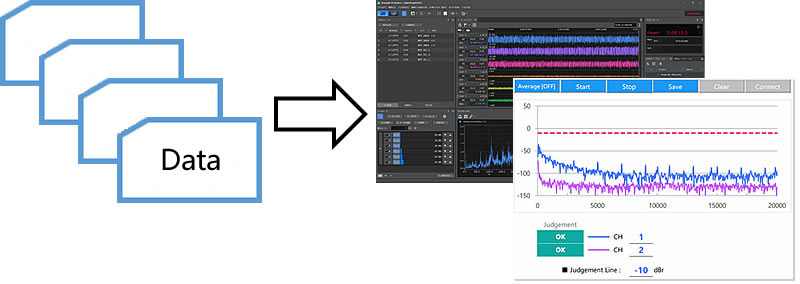
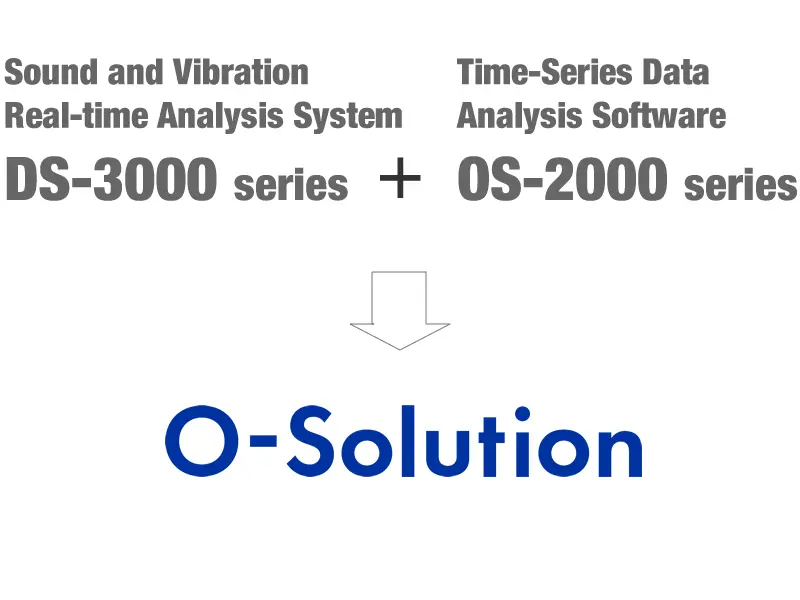
The O-Solution is a software that integrates the DS-3000 series Real-time analysis software and the OS-2000 series Time-series data analysis software. It has "Measurement mode" performed by connecting to the DS-5000 and "Analysis mode" for editing recorded data and detailed analysis in one application.
Hardware
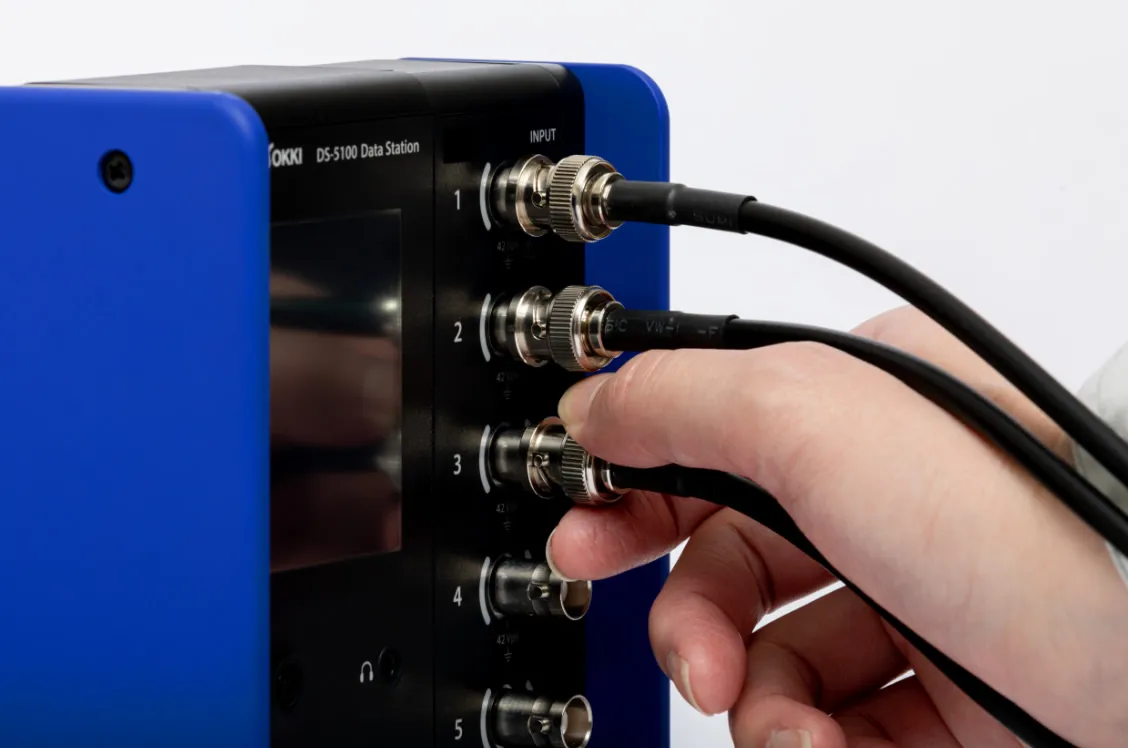
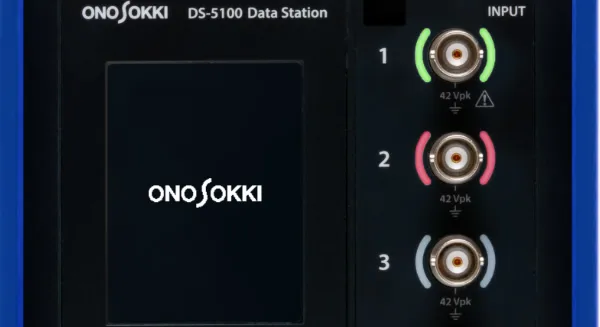
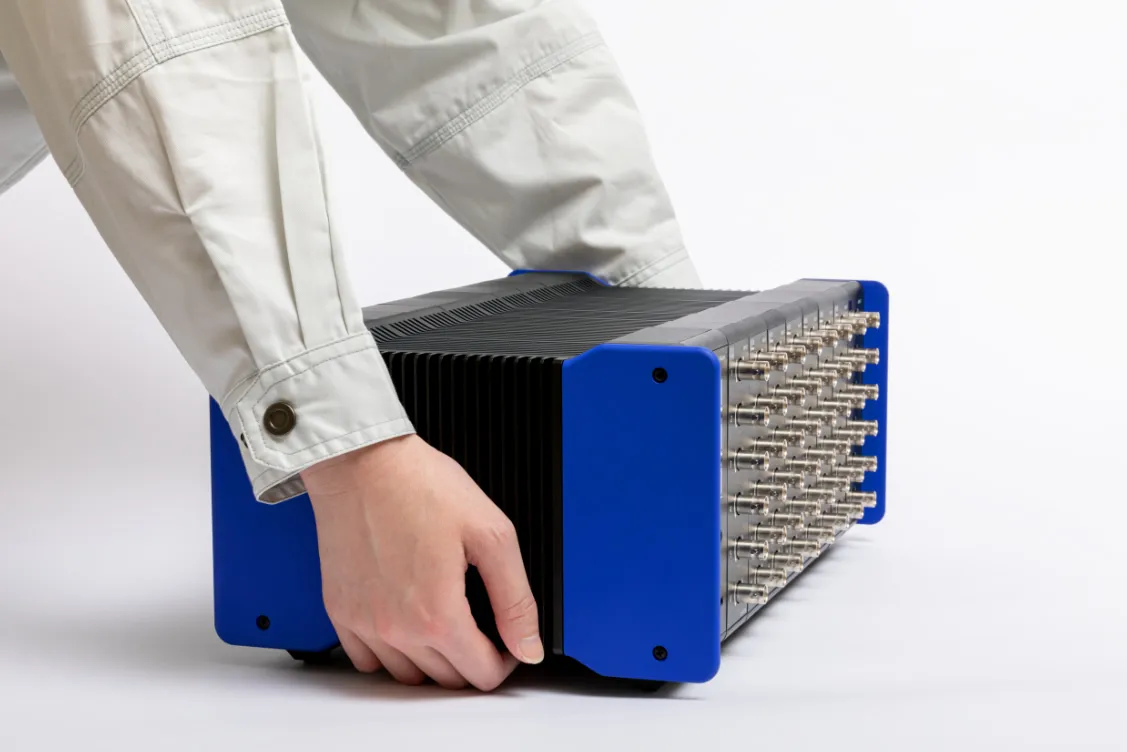
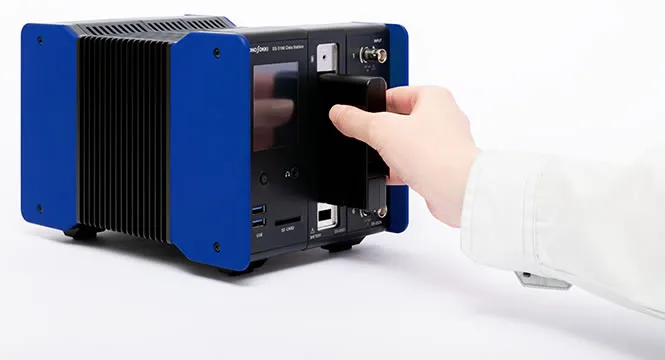
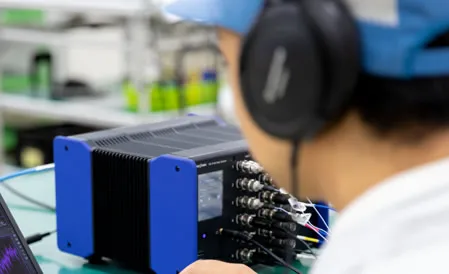
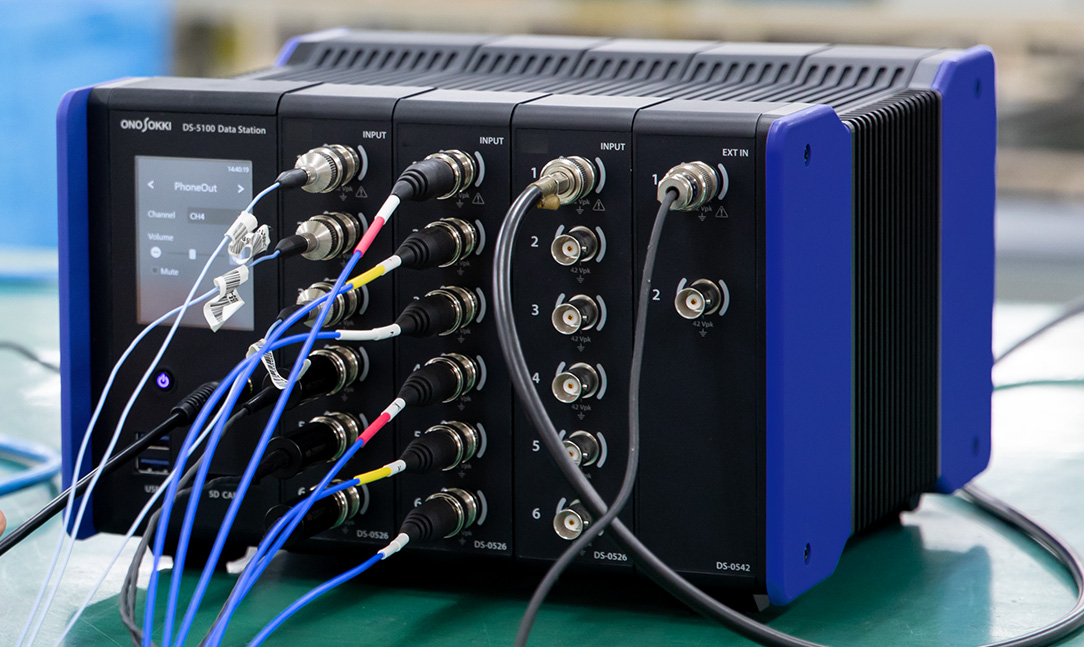
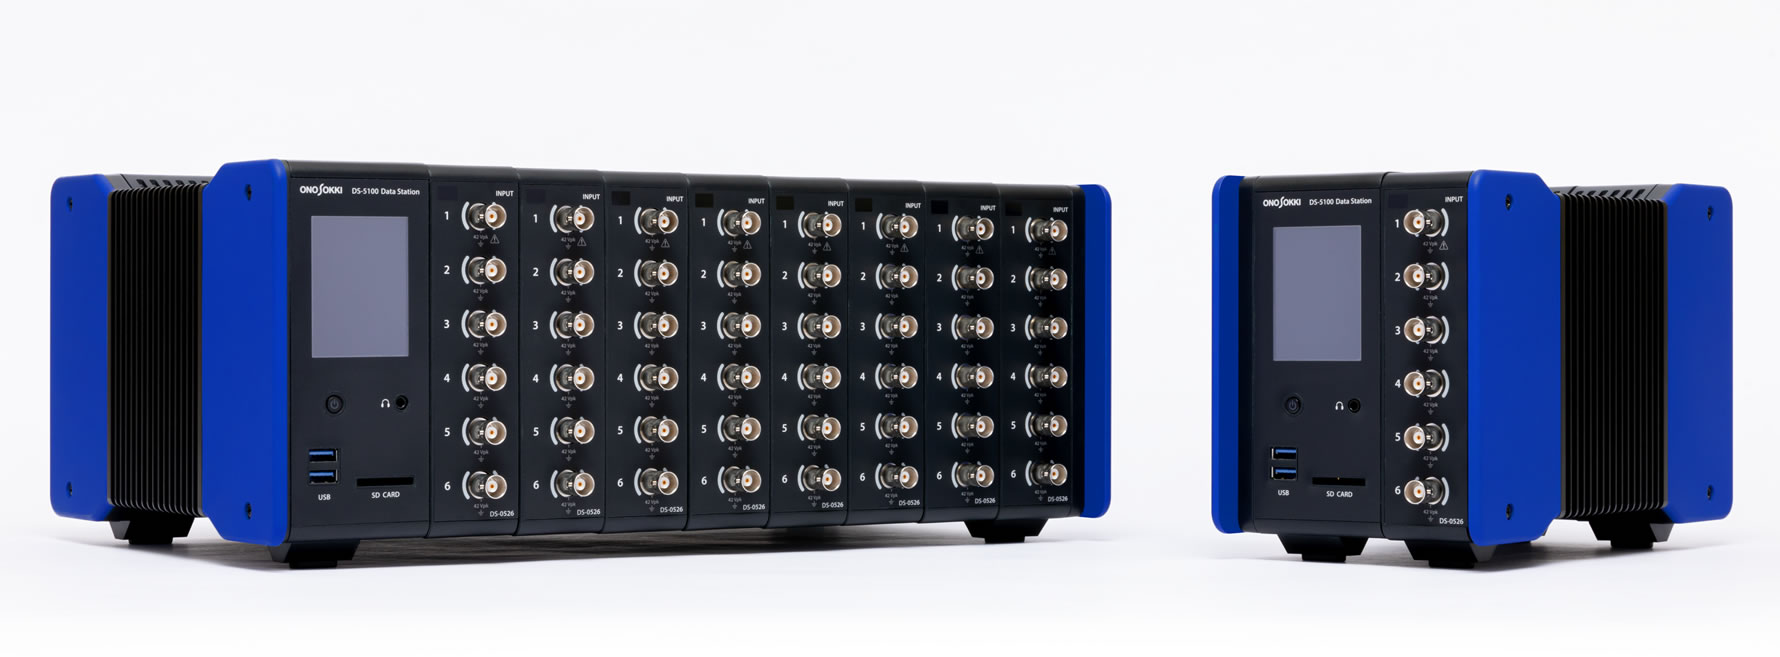
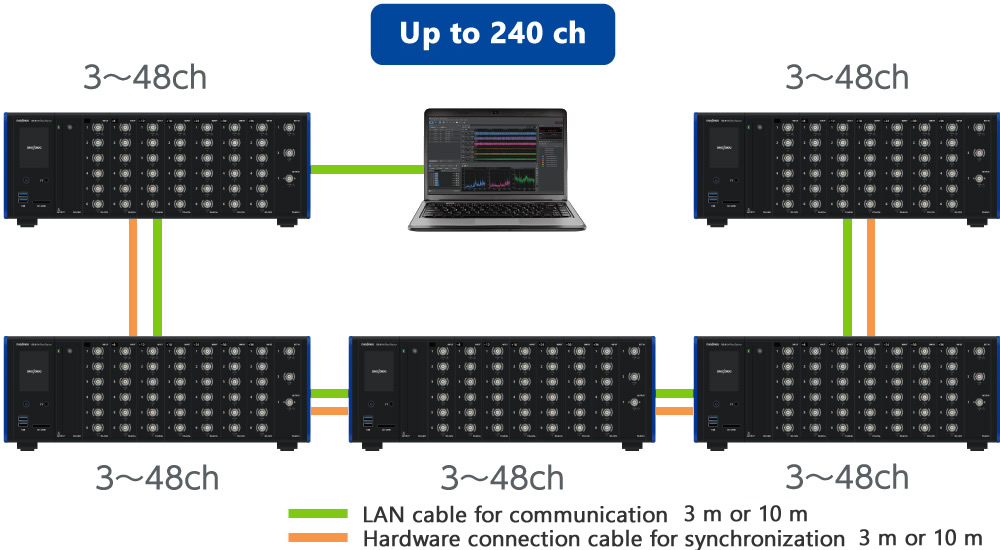
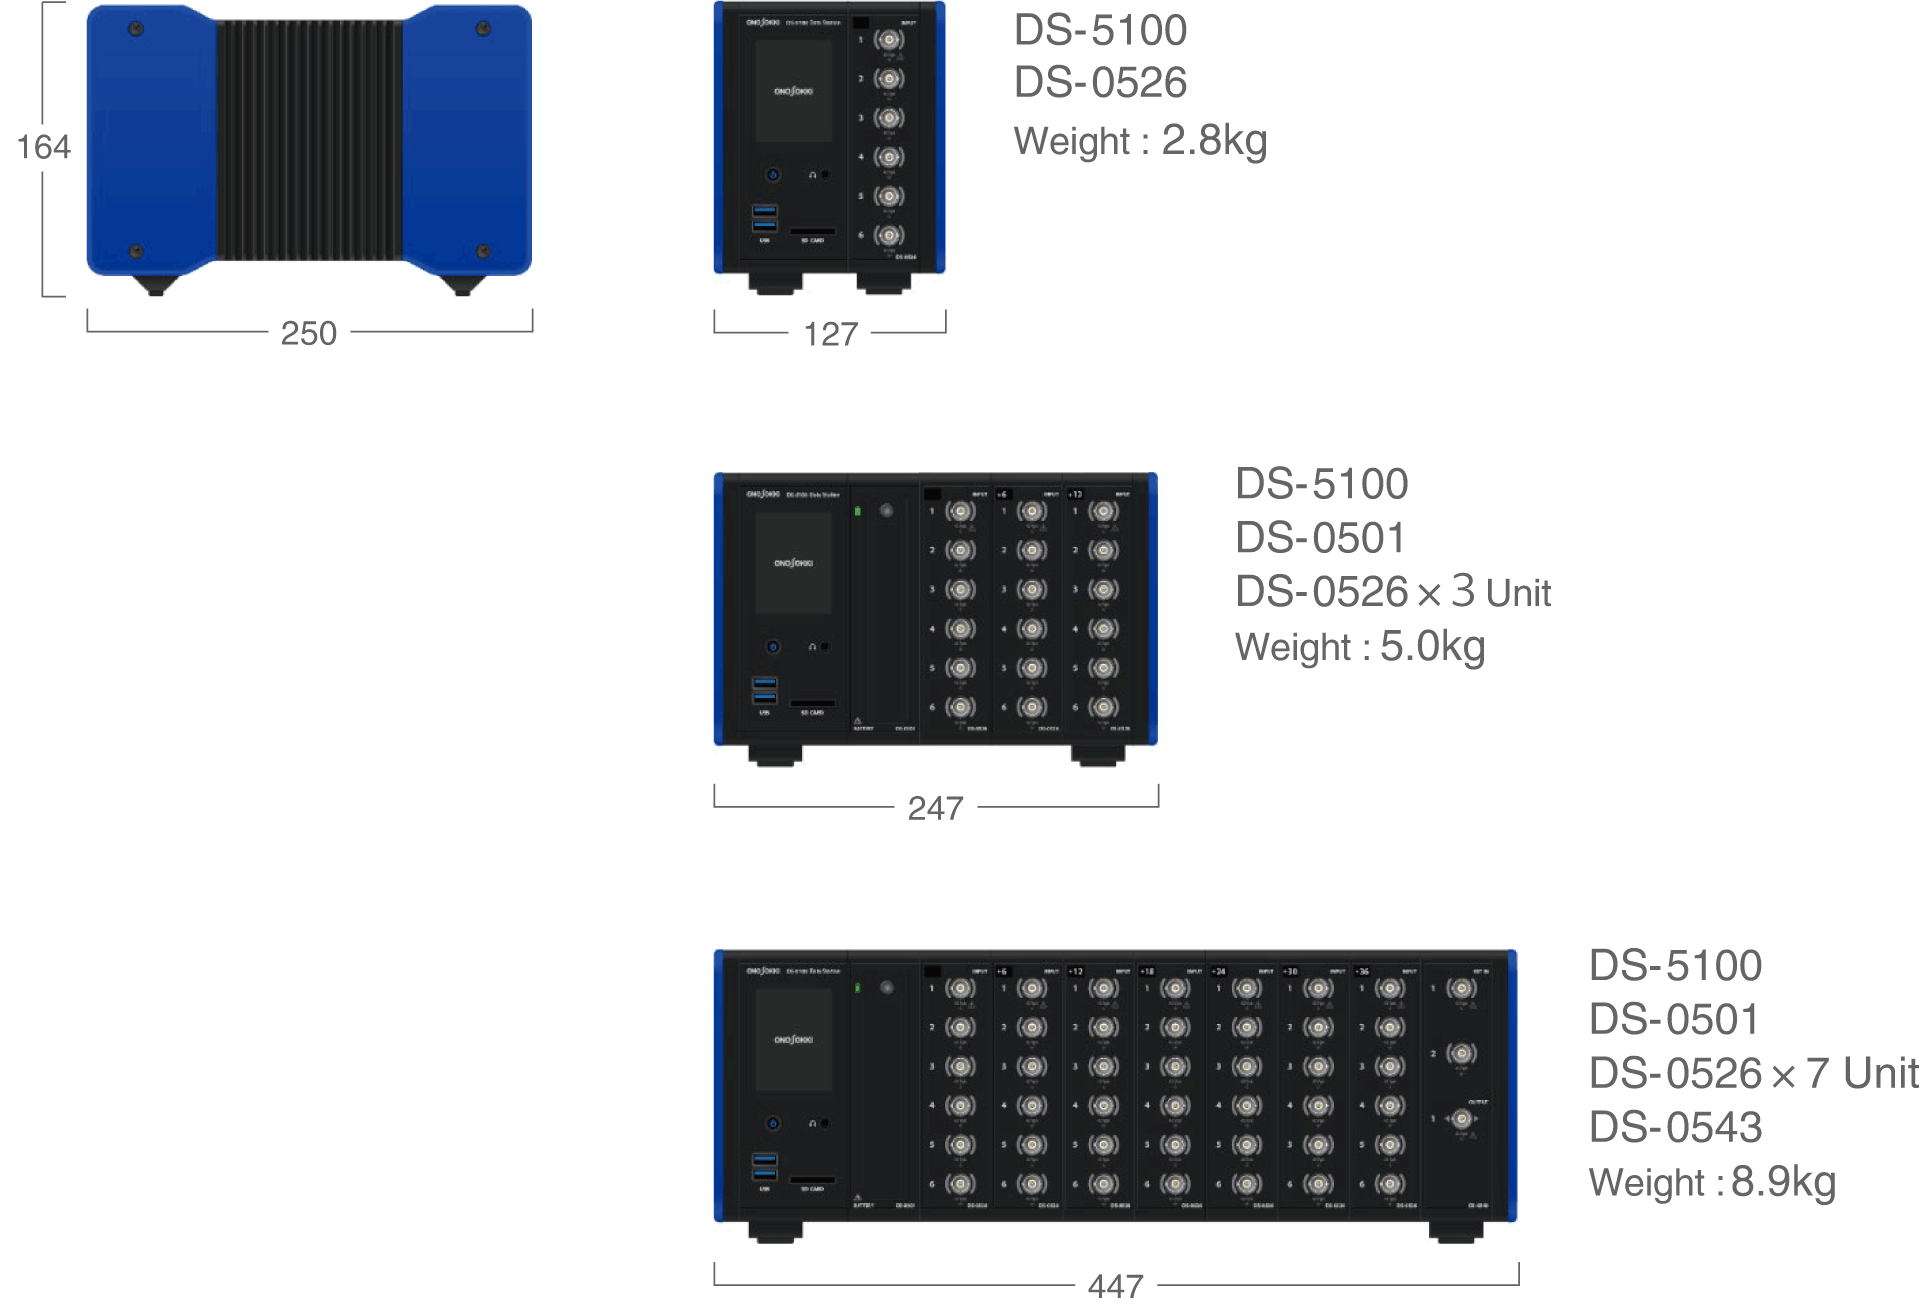
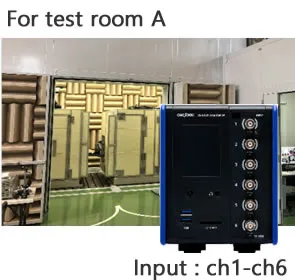
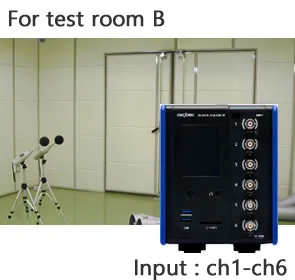
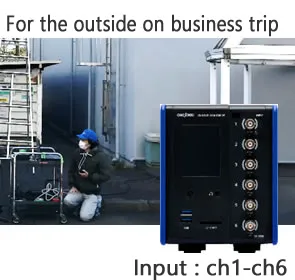
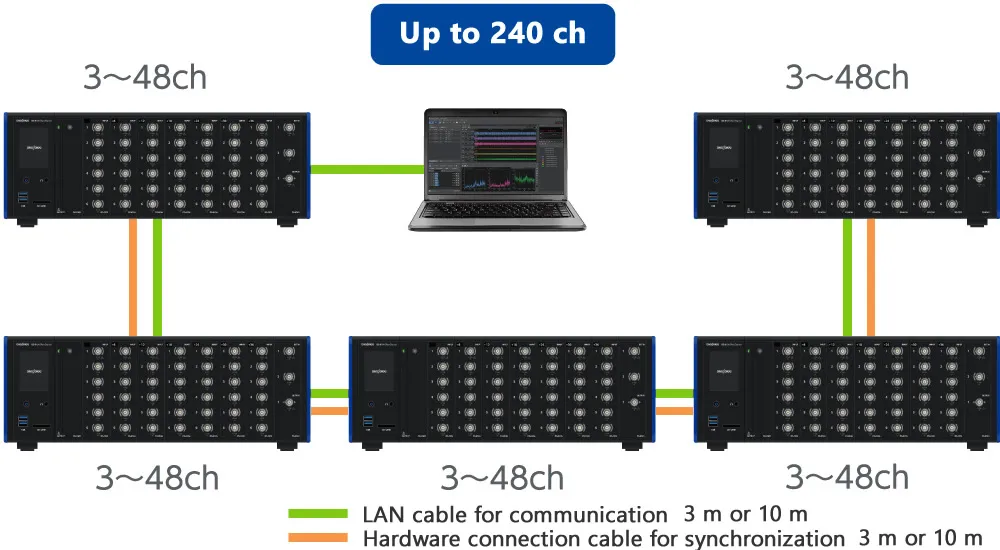
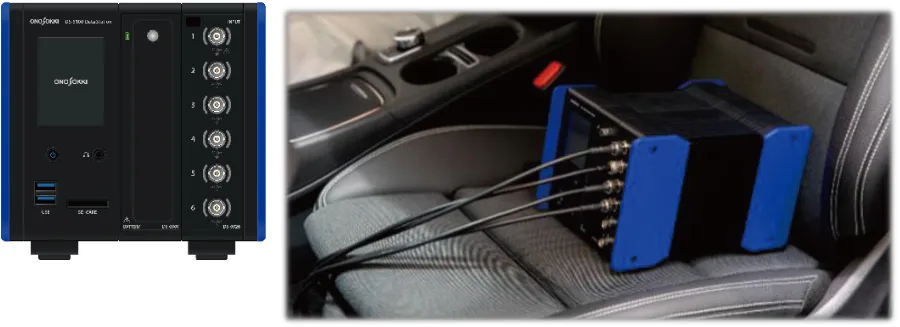
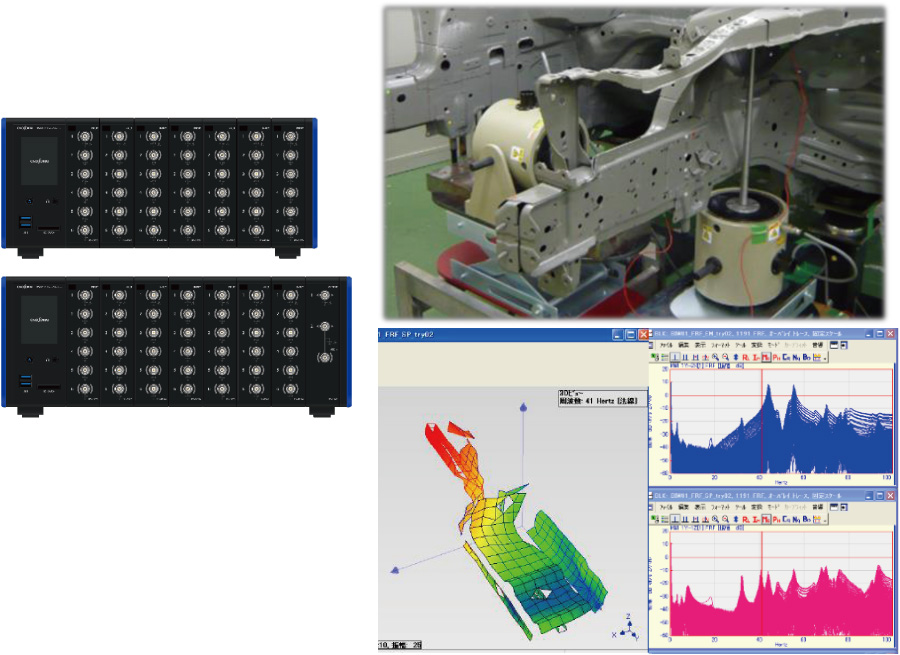
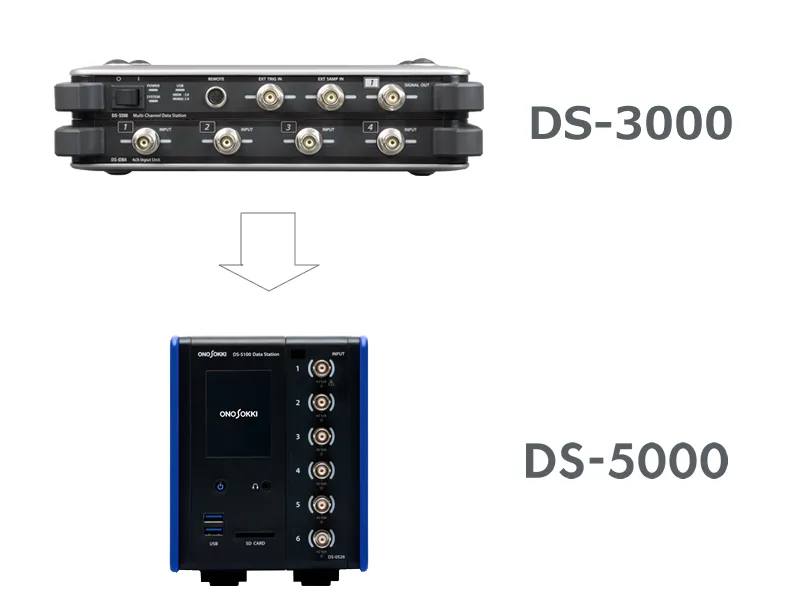
The DS-5000 is a downsized model of the existing model DS-3000 and supports multi-channel measurement (up to 240 channels). All channels isolated and noise resistant hardware.
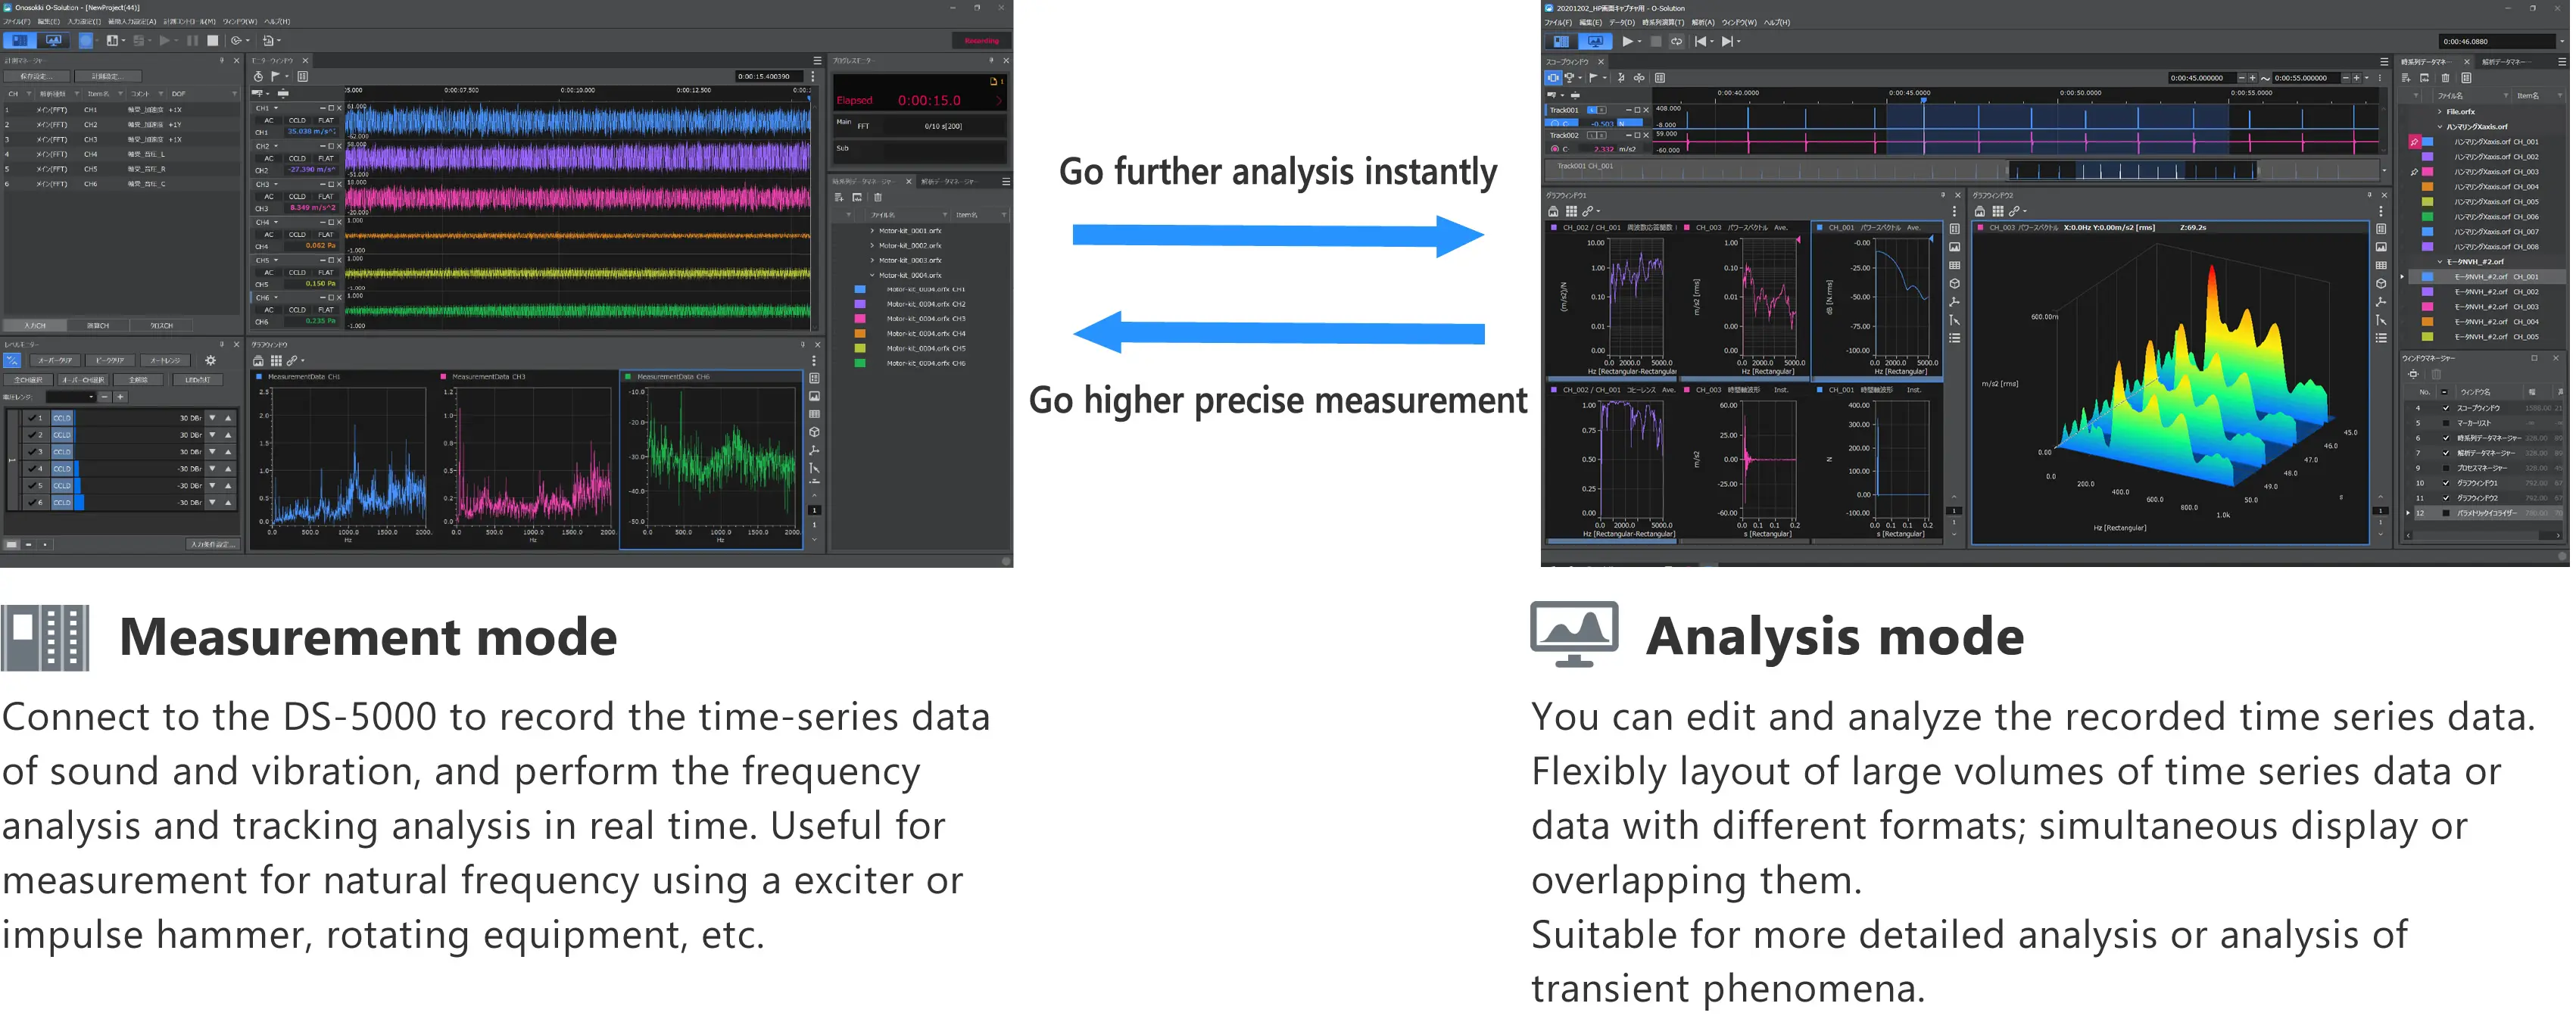
Smooth mode switching between Measurement and Analysis
The O-Solution has "Measurement mode" and "Analysis mode" in one application.
You can quickly check the result in analysis mode after the measurement.
Fulfilled application functions
The basic data processing functions operate on the platform.
You can combine it with the options for your needs, link with other devices using the external control function,
share data with anyone, anywhere using license free viewer function, O-Solution Lite.

Click each product name for details.
Table of functions available in each mode
Available functions vary depending on the mode.

Click each product name for details.
Comparison with OS-2000 series (Time-series Data Analysis Software)
| OS-2000 | O-Solution | Remarks | |
|---|---|---|---|
| Sampling frequency range | 0.01 Hz to 20 MHz | 10 μHz to 100 GHz | Support various data |
| Max. number of analysis data | 4 | 1,000 | per one time operation |
| Max. number of output files | 1 | 1,000 | per one time operation |
| Data size | 2 GB | 1 TB | Support large amount of data |
| Multiple thread processing | Parallelization of analysis work | ||
| External control function | Automation of analysis work |
O-Solution Lite: Viewer
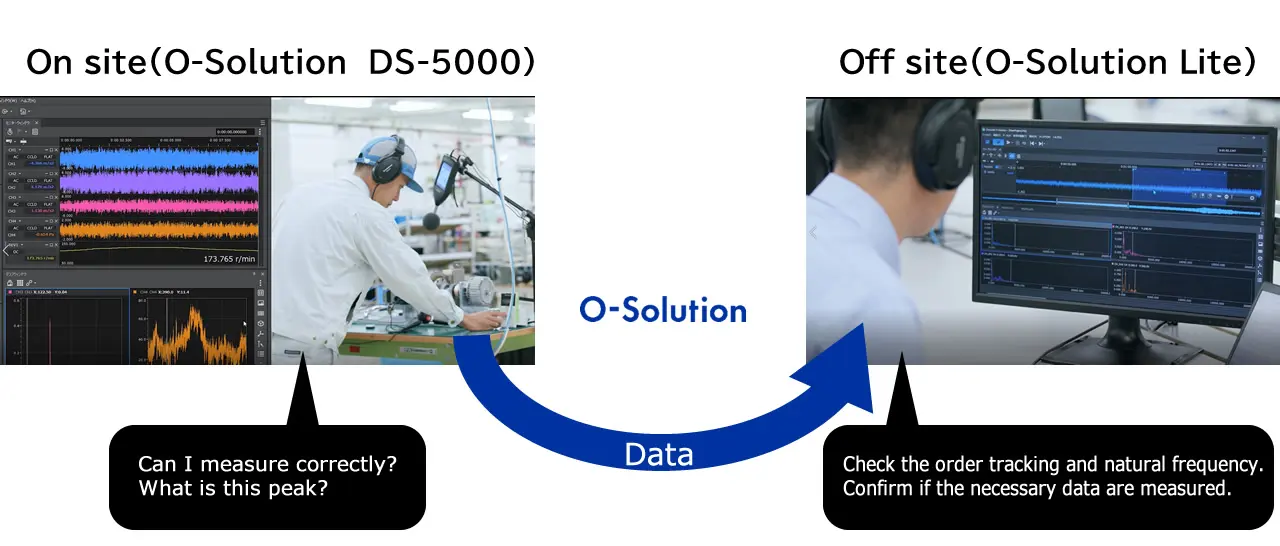
Feature 1: Easy to share the data
You can easily share the data by providing the files that save the measurement data or analysis results with O-Solution Lite to the engineers.
Feature 2: Data recording with DS-5000
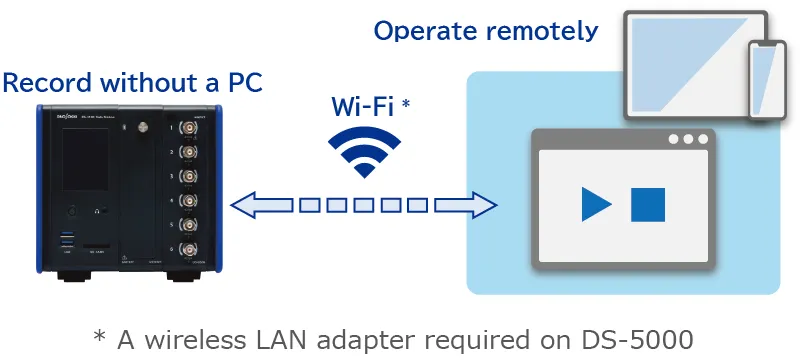
By combining O-Solution Lite and DS-5000, you can use DS-5000 as data logger without any license.
Feature 3: Download from Ono Sokki's website
Anyone can download and use it at once.
O-Solution Platform: OS-5100
It is an application that can freely edit and analyze a large amount of time-series data. By adding optional functions, you can obtain various analysis results.
Flexible screen layout
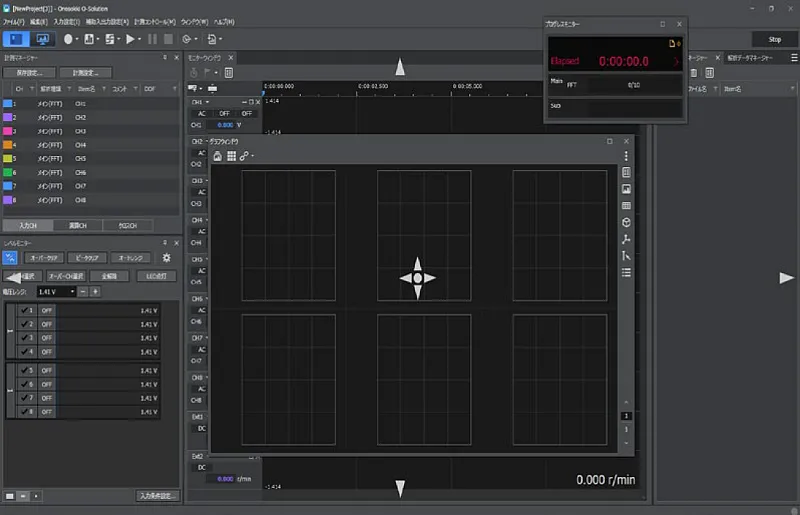
The docking window allows to change the display position of windows to your preferred layout.
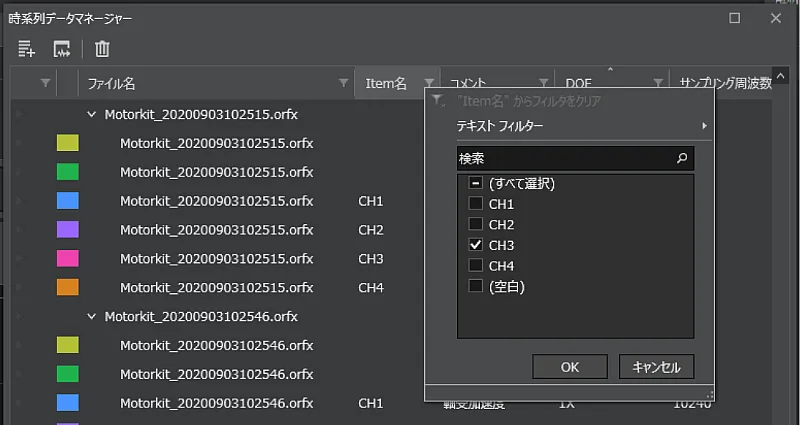
Easy data management
O-Solution collectively manages measurement and analysis conditions and acquired data in a projects. The data manager allows you to see the data list, search/sort functions enable comparing muliple conditions and channels.
 Measurement mode
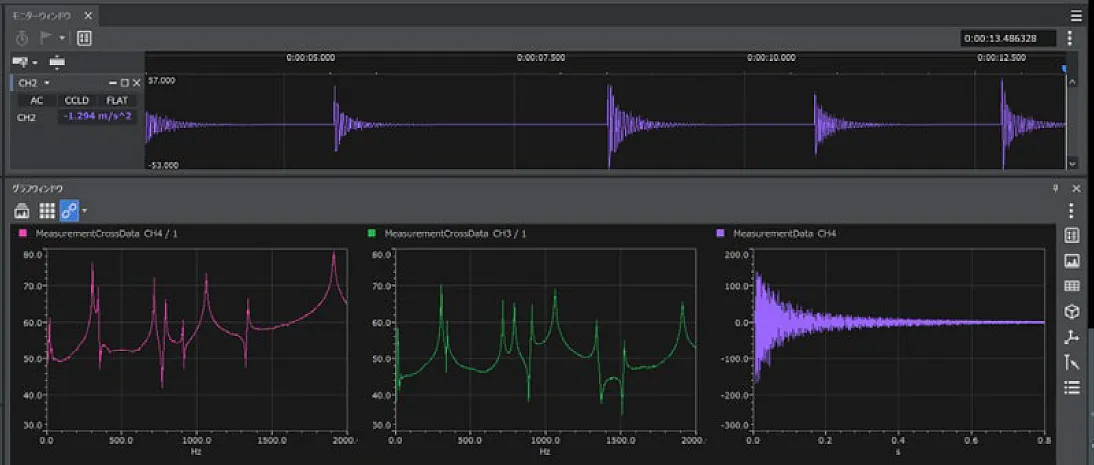
Quickly grasp the measurement status
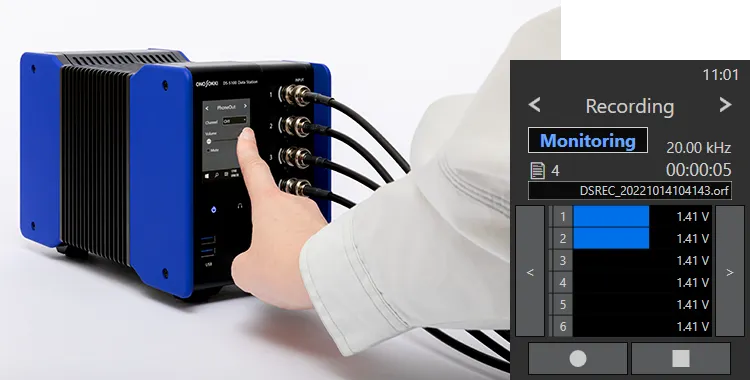
A monitor window that displays the time waveform (10 seconds) allows you to set and measure while observing the time waveform.
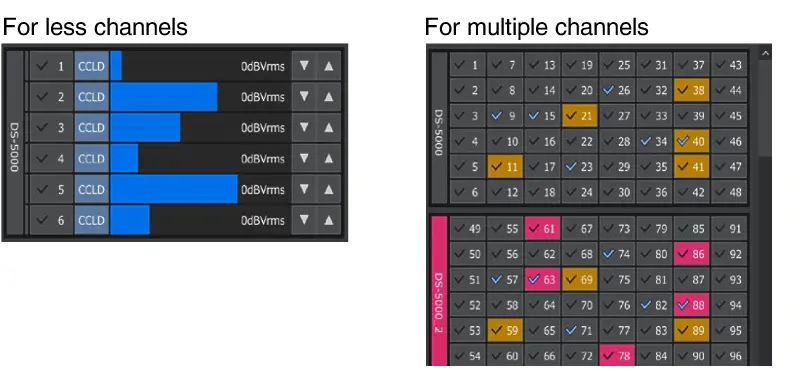
Perfect monitoring
All the level can be monitored in one screen. The layout of the level monitor screen can be changed depending on the number of channels or units.
Simultaneous dual analysis
Simultaneous analysis while recording allows you to work in a minimum time.
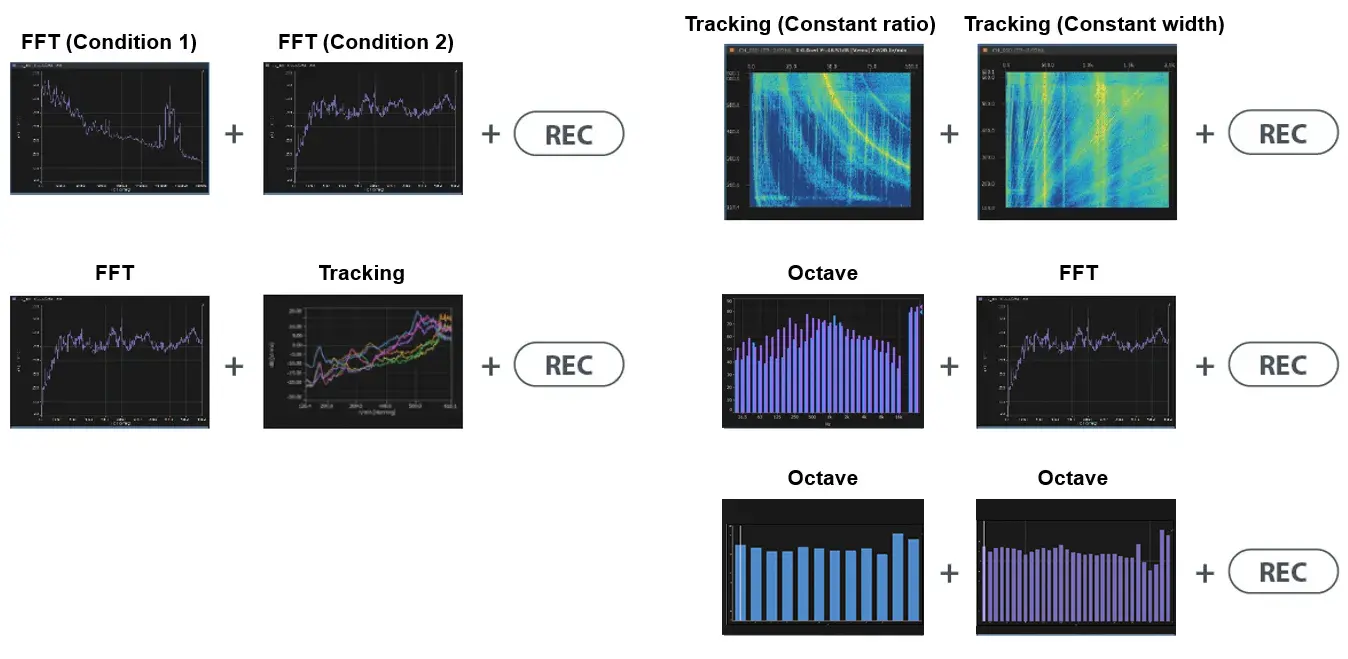
*As for the following combinations, simultaneous analysis is not available.
- Octave + Tracing + REC
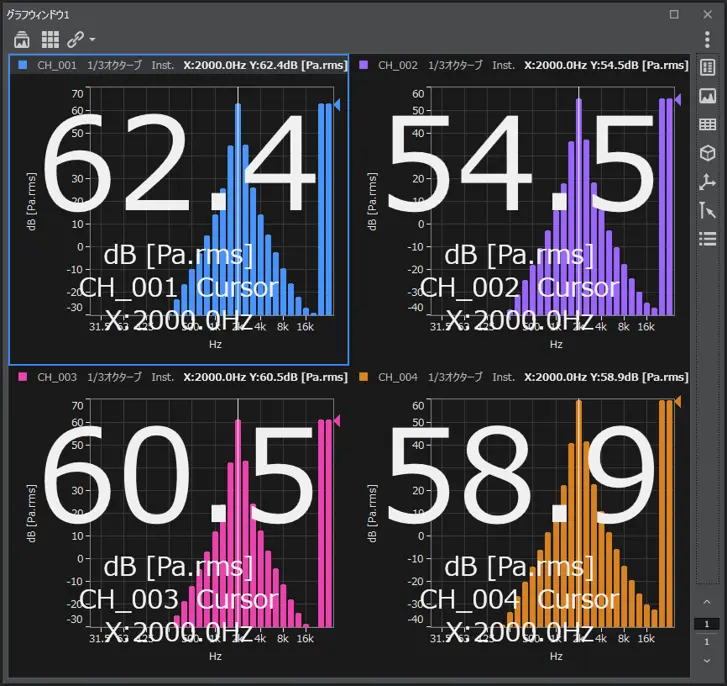
Numerical values enlarged
The measurement values you focus on can be checked more easily.
Quick Access Window
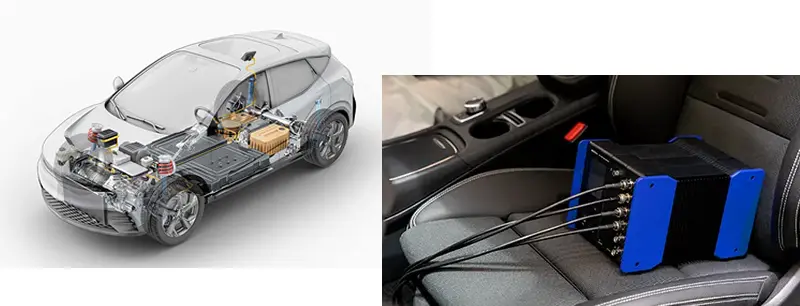
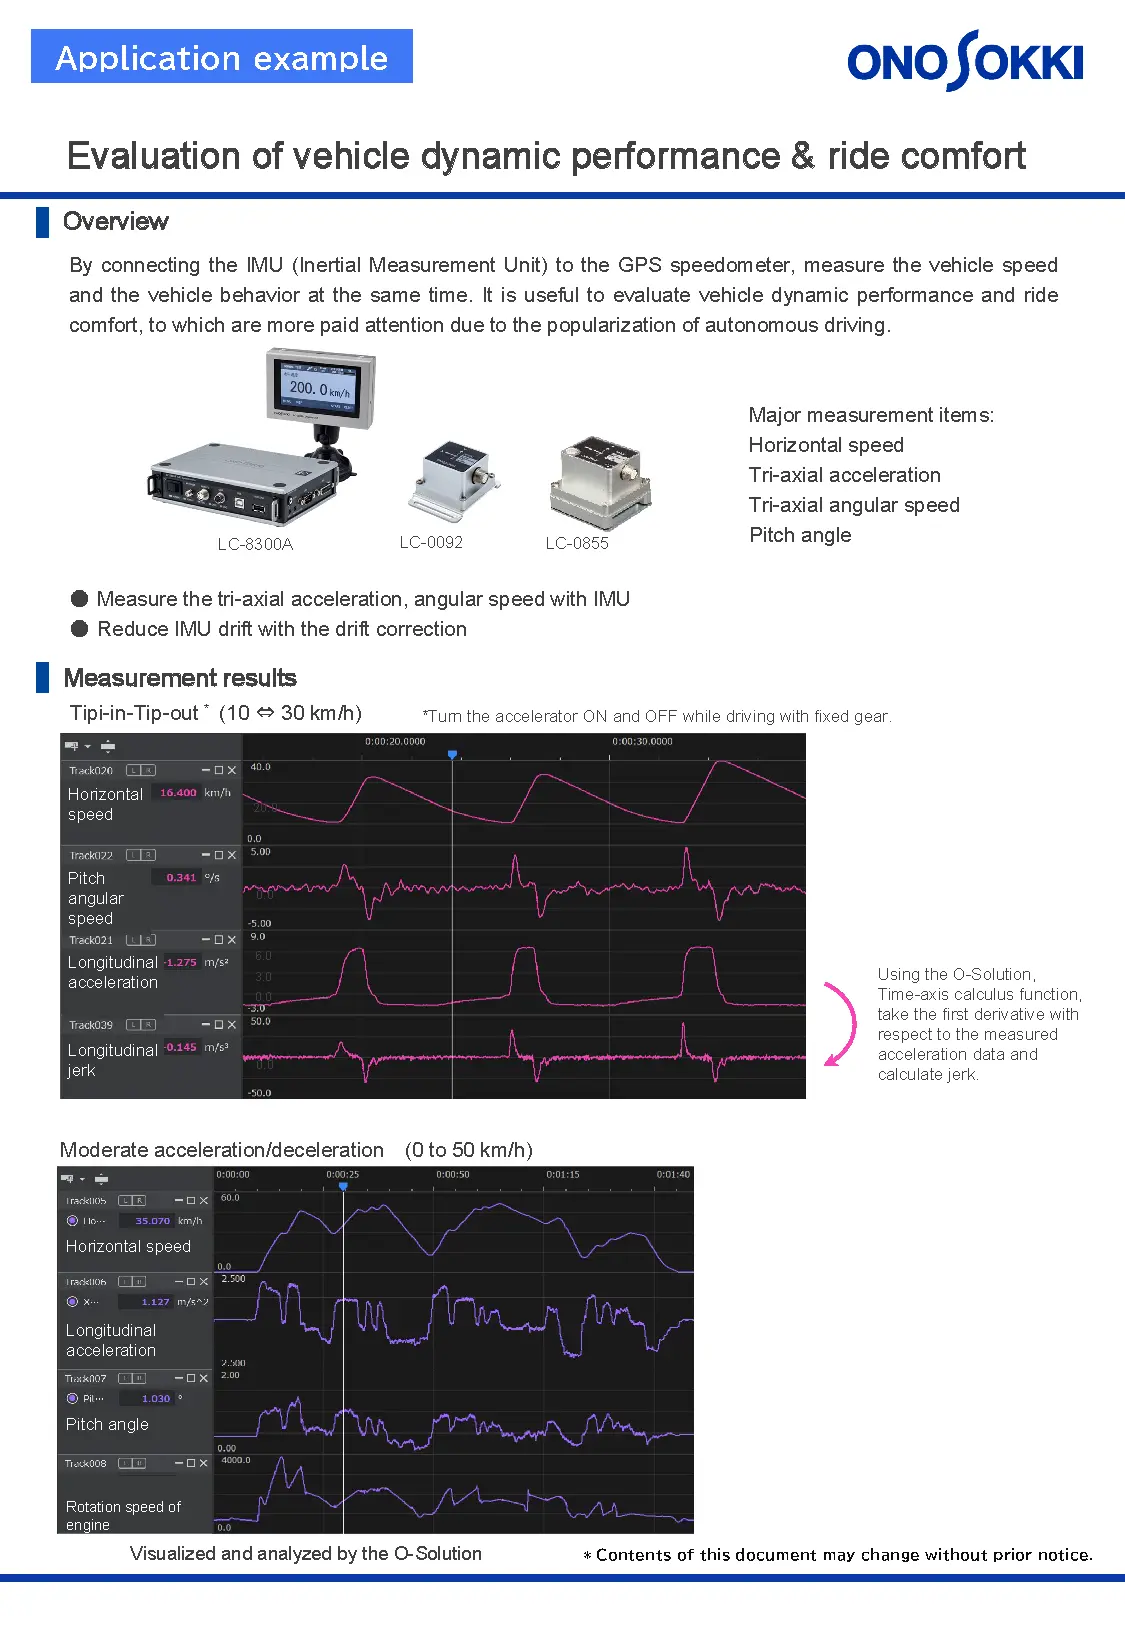
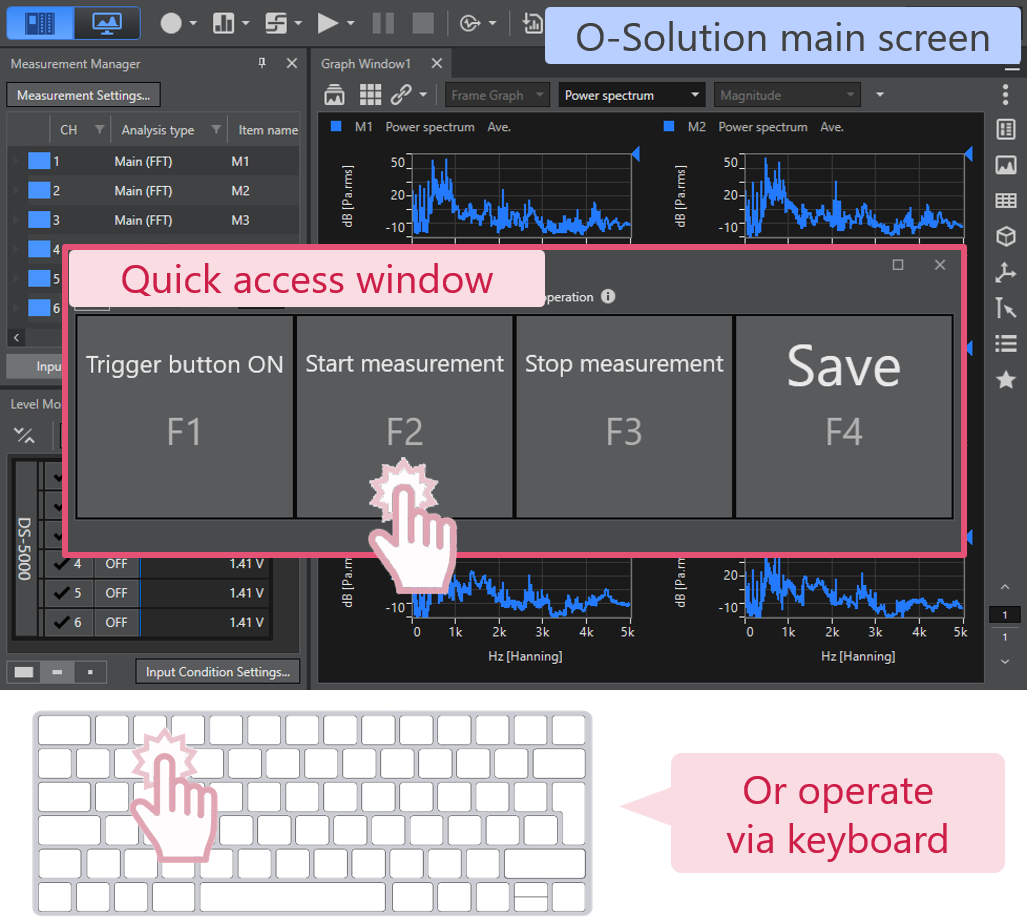
Frequently used operations such as starting a trigger and starting measurements can be displayed on the screen as large shortcut buttons. By customizing them for standard tests in automotive driving tests and on-site measurements, operability is improved. Buttons can also be registered as keyboard shortcut keys. In addition, if the external control function (OS-0510) is installed, repetitive operations can be assigned to a single button.
Replay analysis
In the measurement mode, you can analyze the recorded time-series data while replaying it. It enables to perform preliminary analyses repeatedly before switching to the analysis mode, improving the efficiency of determining analysis conditions.

Measurement Condition List/Analysis Condition List
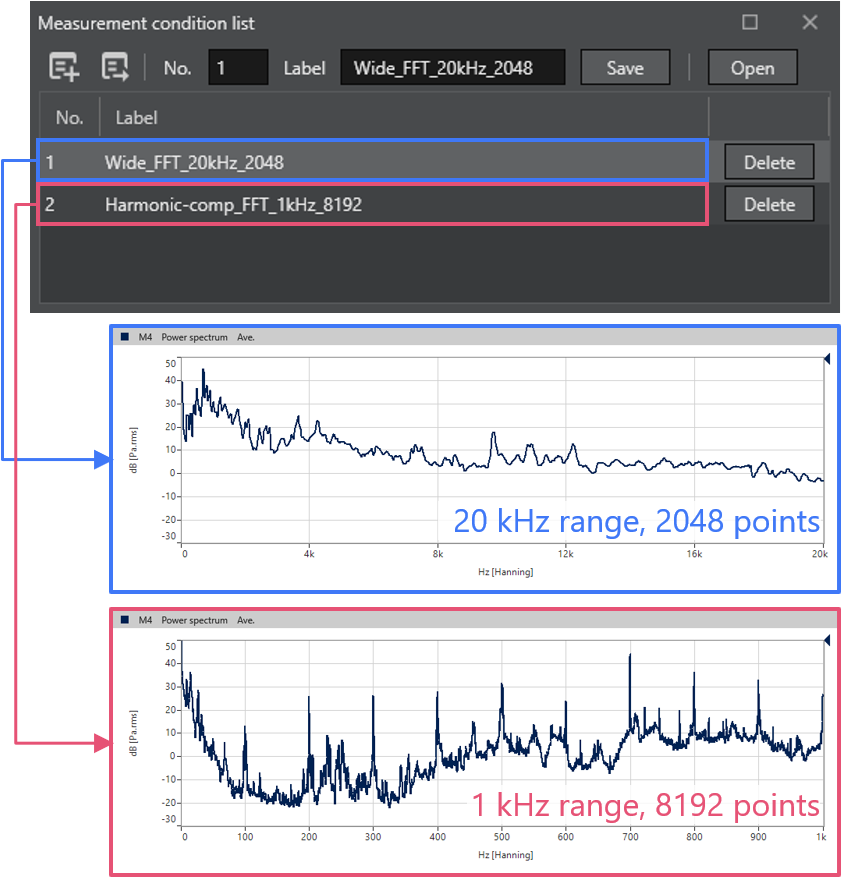
You can easily switch between pre-registered measurement conditions with a single click. This proves particularly useful when multiple predefined measurement methods exist, such as for standard tests. Switching between conditions without repeated input prevents setting errors and improves operational efficiency. Similarly, post-analysis processing conditions can be switched with a single click.
Add graph setting items to 'Favourites'
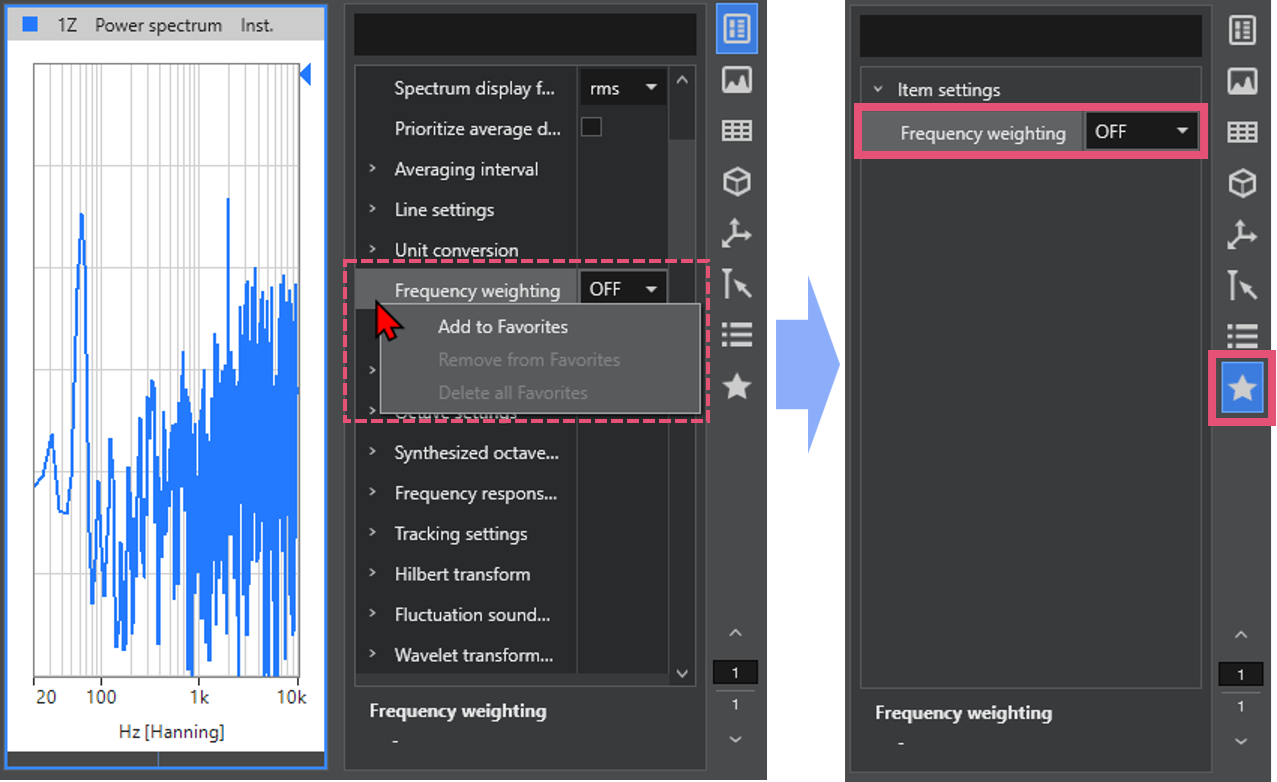
The O-Solution offers various setting items, such as the spectrum format and unit conversion on the graph display. Frequently used settings can be saved as Favourites. By grouping commonly used settings for the standard test, you can improve the efficiency of your analysis work.
 Analysis mode
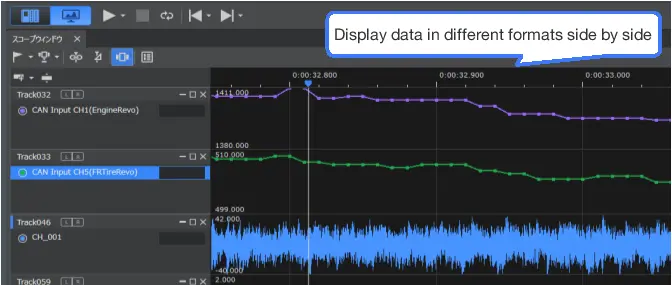
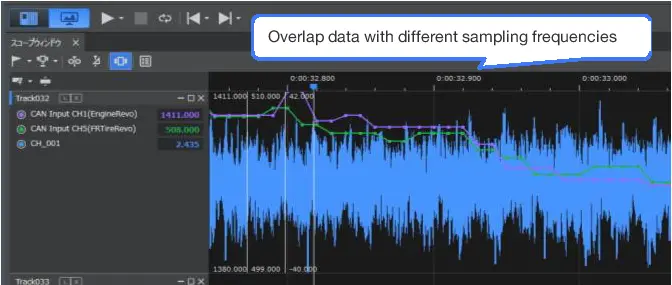
Easy grasping of physical phenomena
You can flexibly layout the data in different formats or sampling frequencies; simultaneous display, overlapping, displaying side-by-sid
Import project files created by the OS-2000 series
In automotive development, the OS-2000 series has been used for data verification tasks on measurement and control benches, enabling the comparison of multiple time-series data. The O-Solution allows the direct import of vast measurement data from within the OS-2000 series projects (supporting only the restoration of time-series waveforms). Even if only project file data created in the OS-2000 series remains without the raw data, the O-Solution can restore the data, enabling smooth management and verification of historical data.
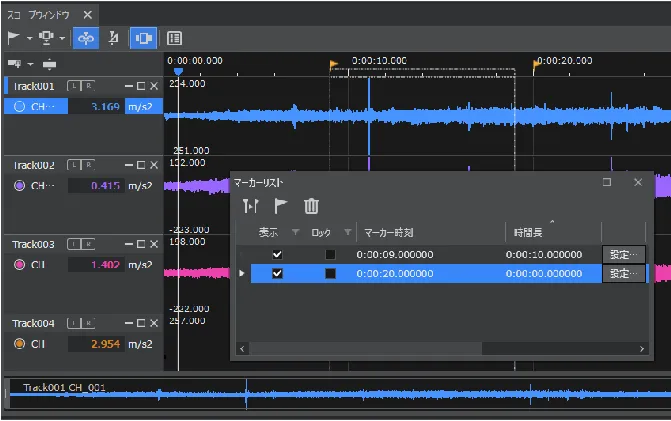
Marker function allows further analysis on specified area
You can add markers to the specified areas in the long recorded data. Also set the analysis range based on the marker.
Support the formats of other company's loggers


Importer
You can choose to copy the time series data files into your project file, or to reference them without copying them. Referencing method will reduce time to import the files and also the size of your project files.
For example, 96ch, file with 10 minutes of recording data
| Importing method | Importing time |
| Copying to a project | 296 sec |
| Without copying (referencing) | 120 sec* |
* For orfx files only.
* If the path of the referencing file changed, reimporting is required.
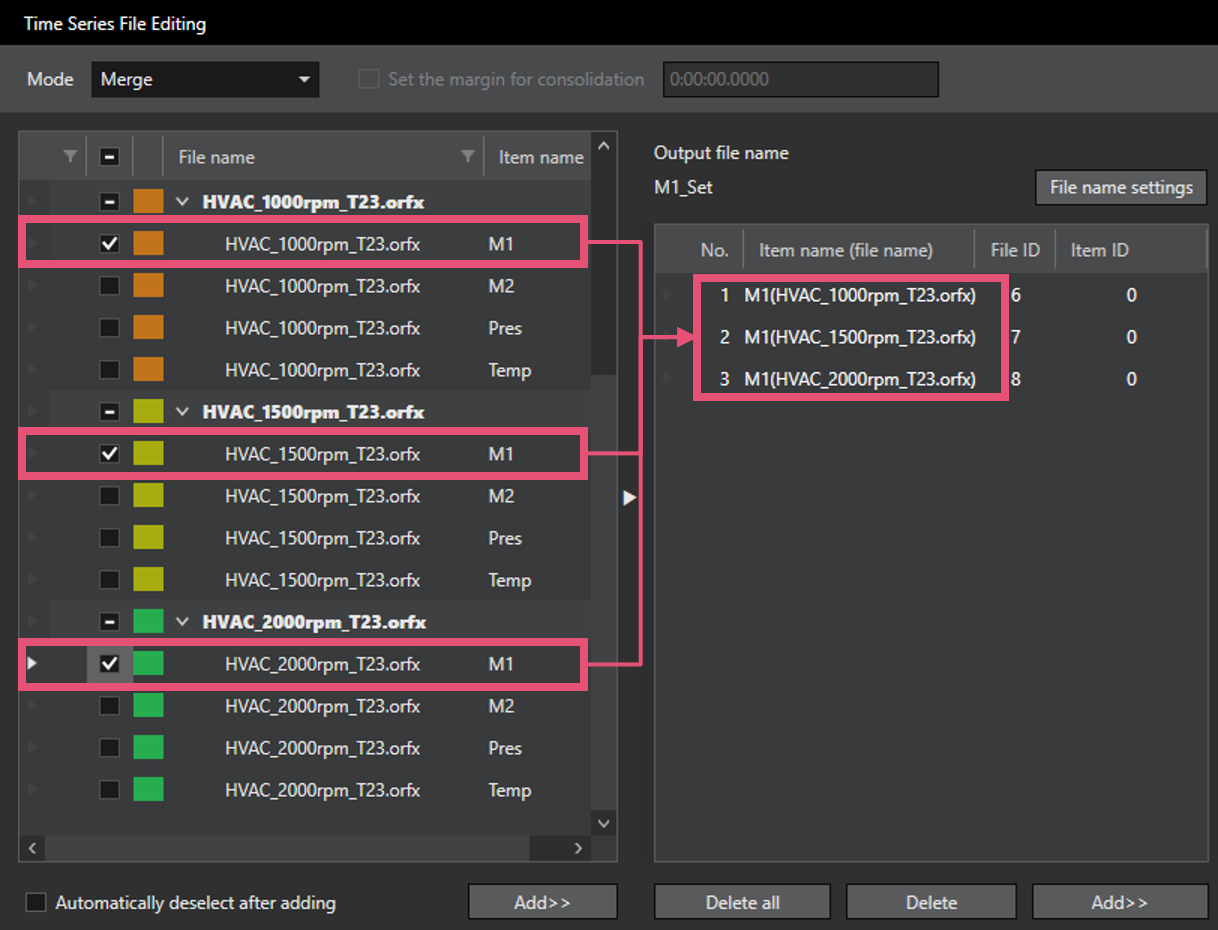
File Editing (Merge mode)
You may select any channel from multiple recorded data and merge them into a single file. It enables to efficiently carry out tasks such as comparing sounds or analysing data.
O-Solution options
Optional software is available for various purposes.
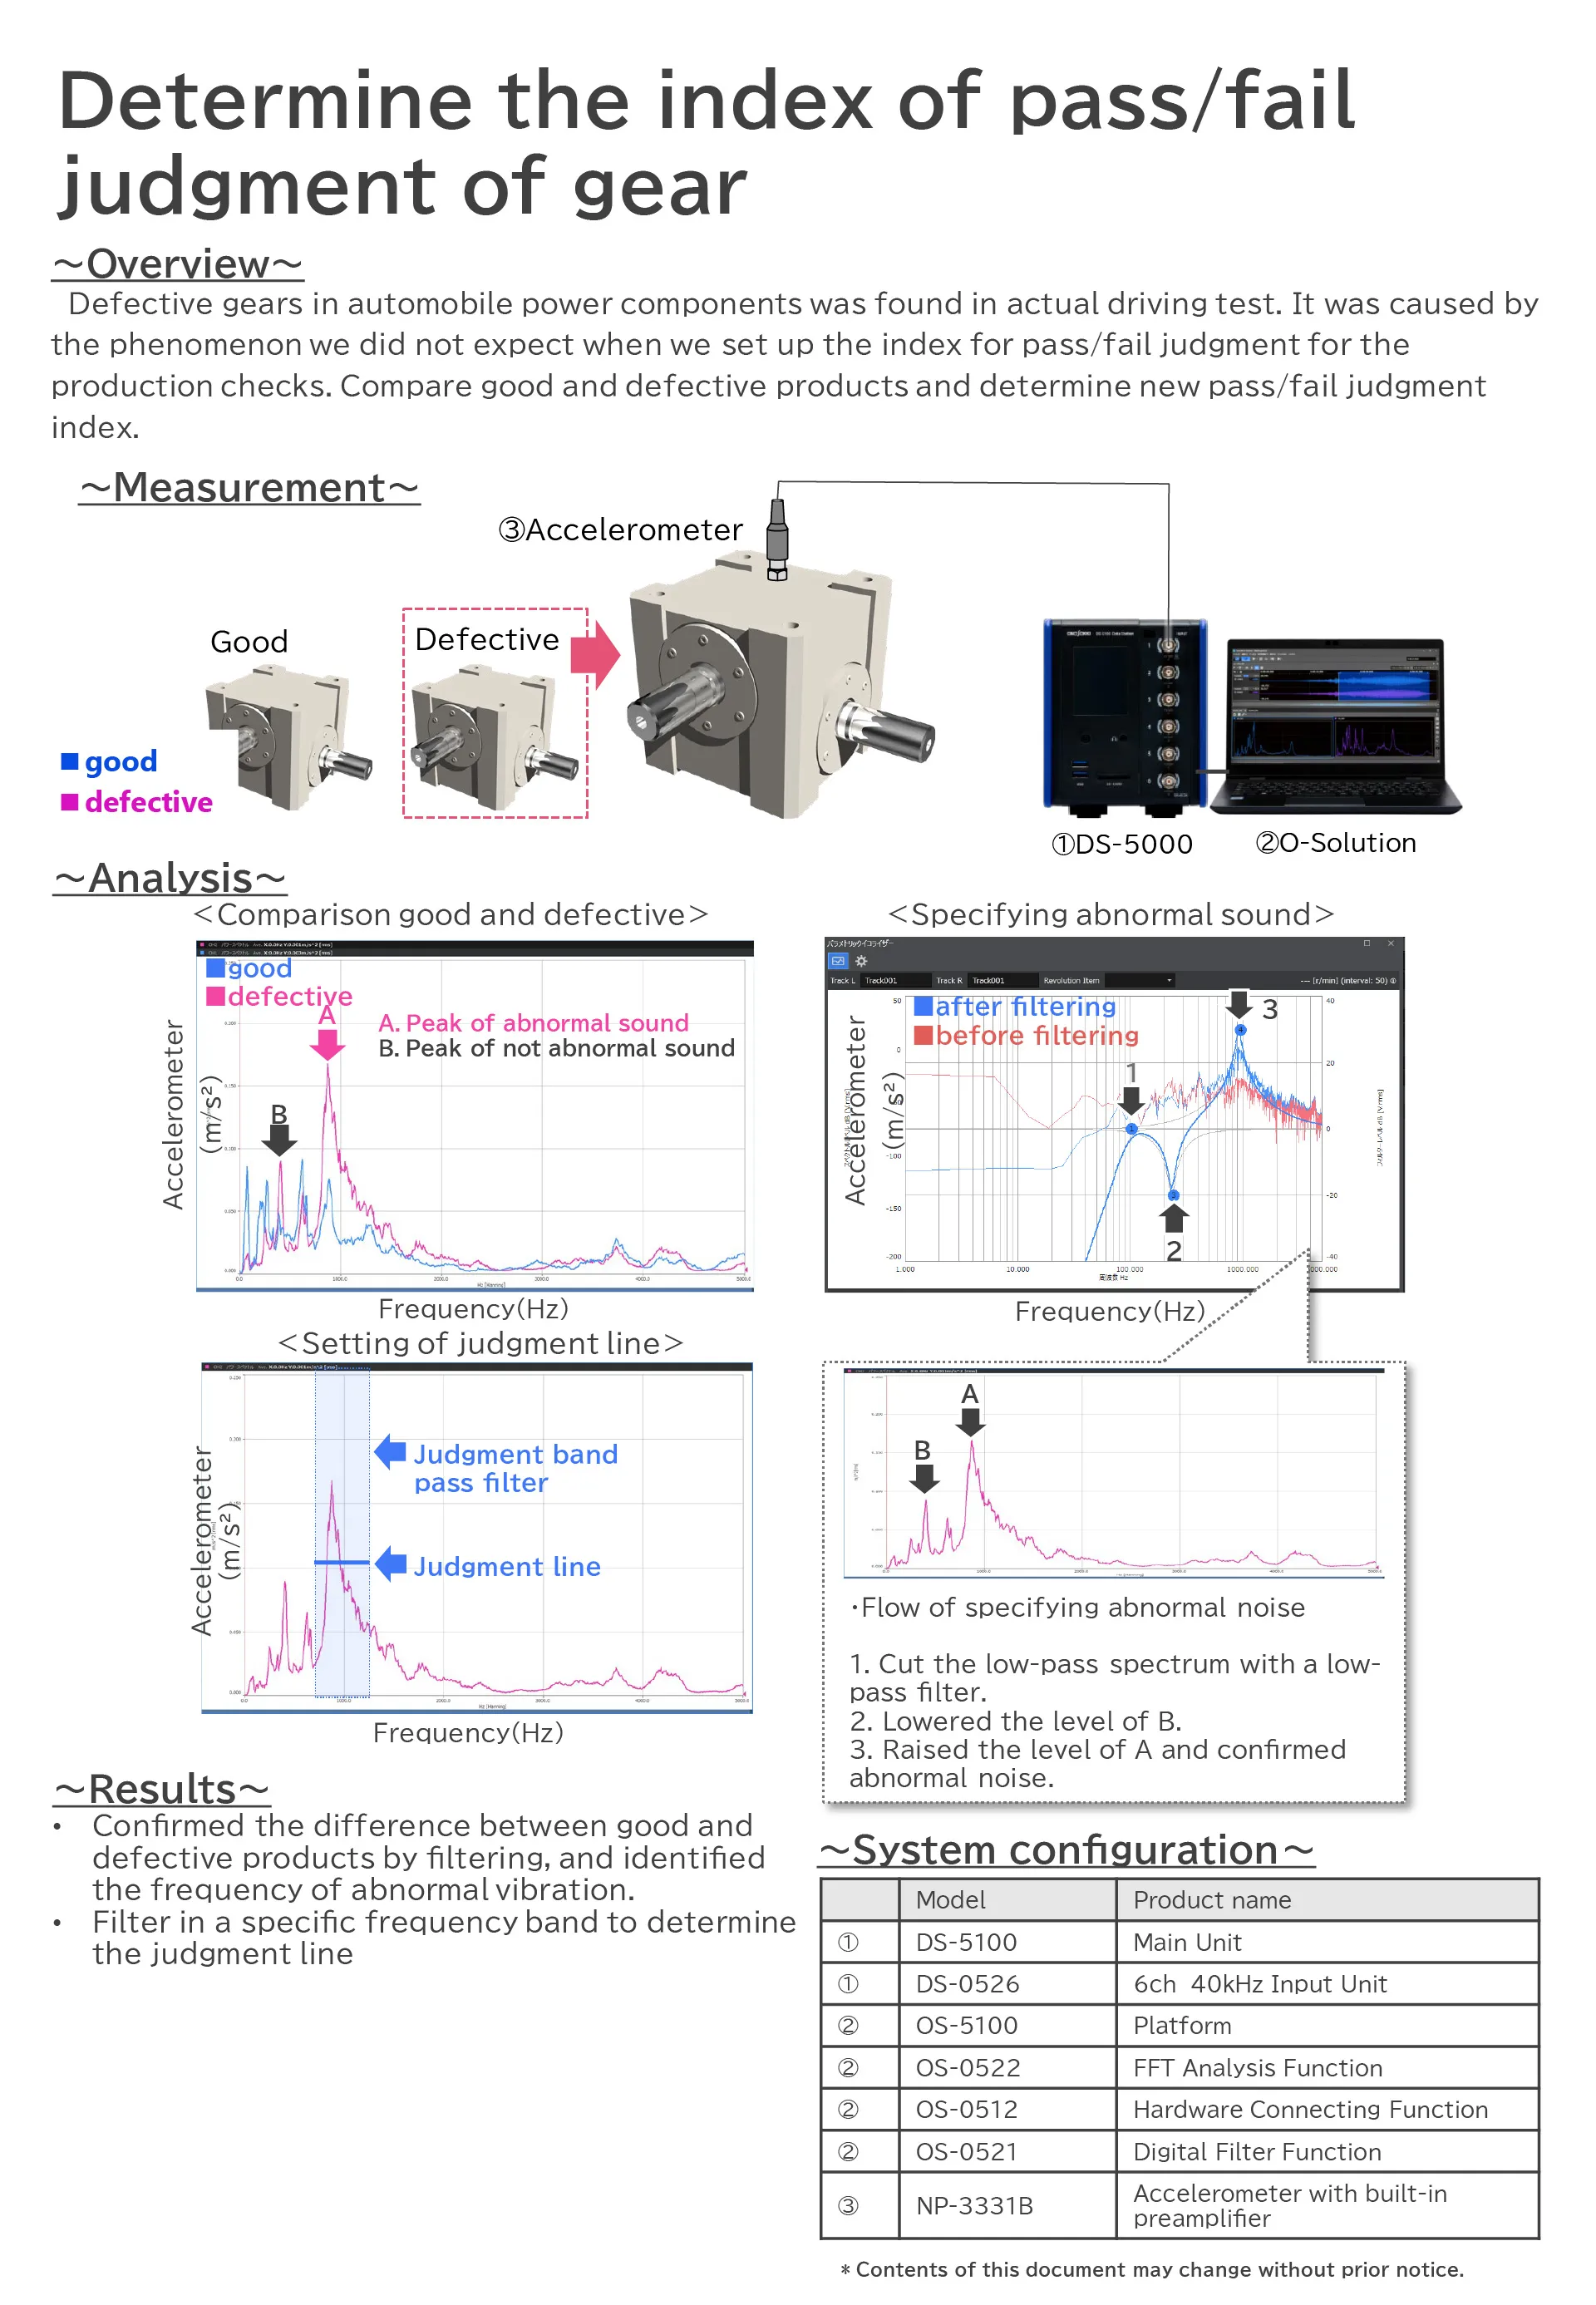
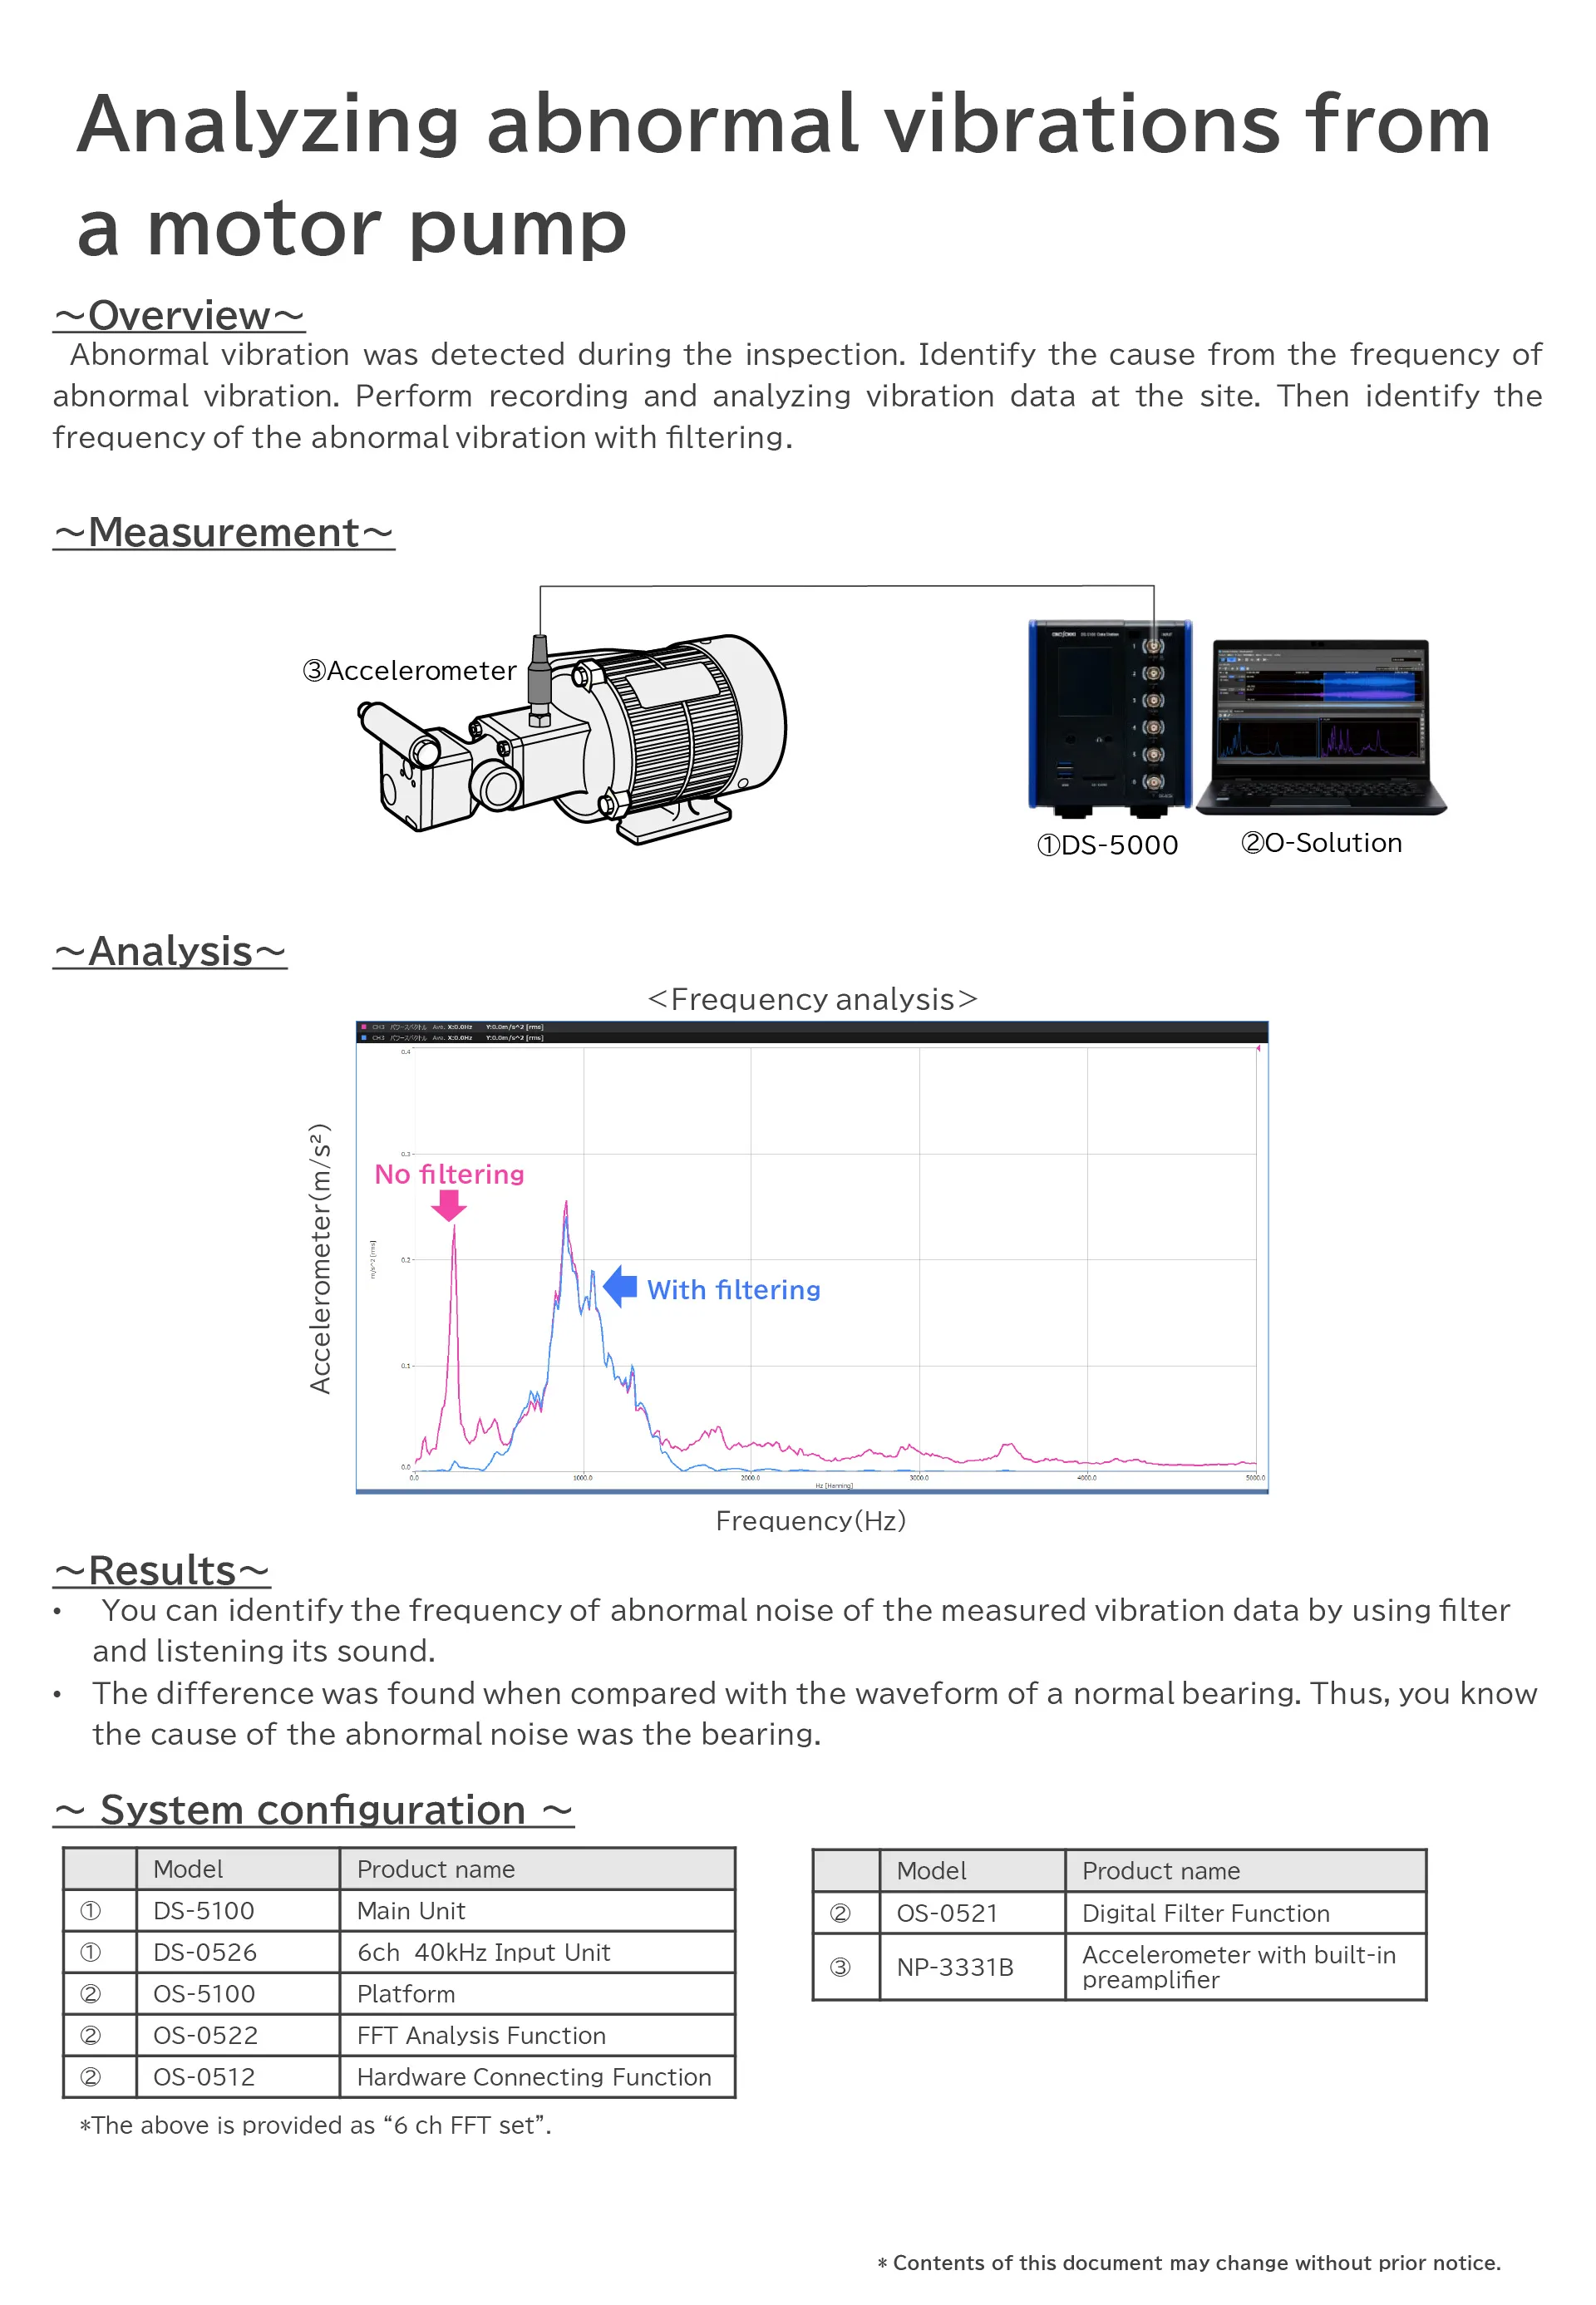
Digital Filter Function: OS-0521
Find quickly the frequency band of the noise
You can quickly find the frequency band that causes noise or vibration by applying an IIR or FIR filter to the recorded data and listening to the sound.
The filter applied time series data can be saved as another file.
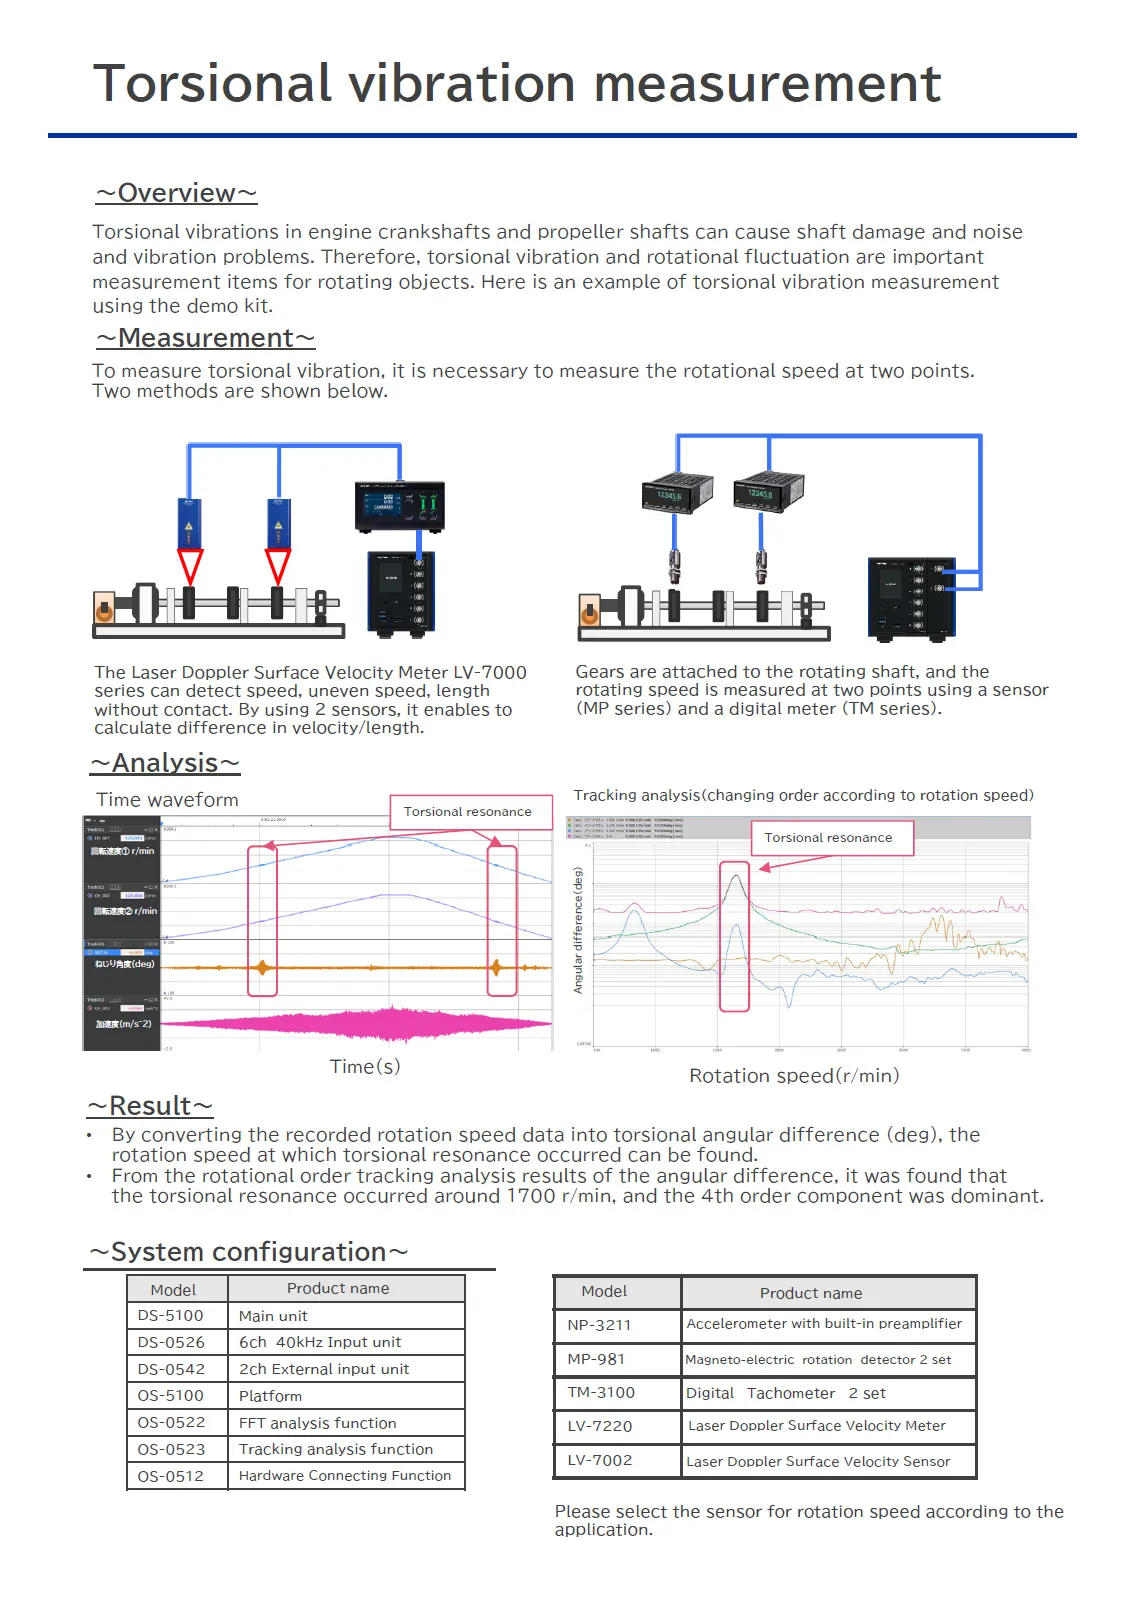
To apply filter to the order and frequency at the same time is useful for investigating abnormal noises in rotating object.


FFT Analysis Function: OS-0522
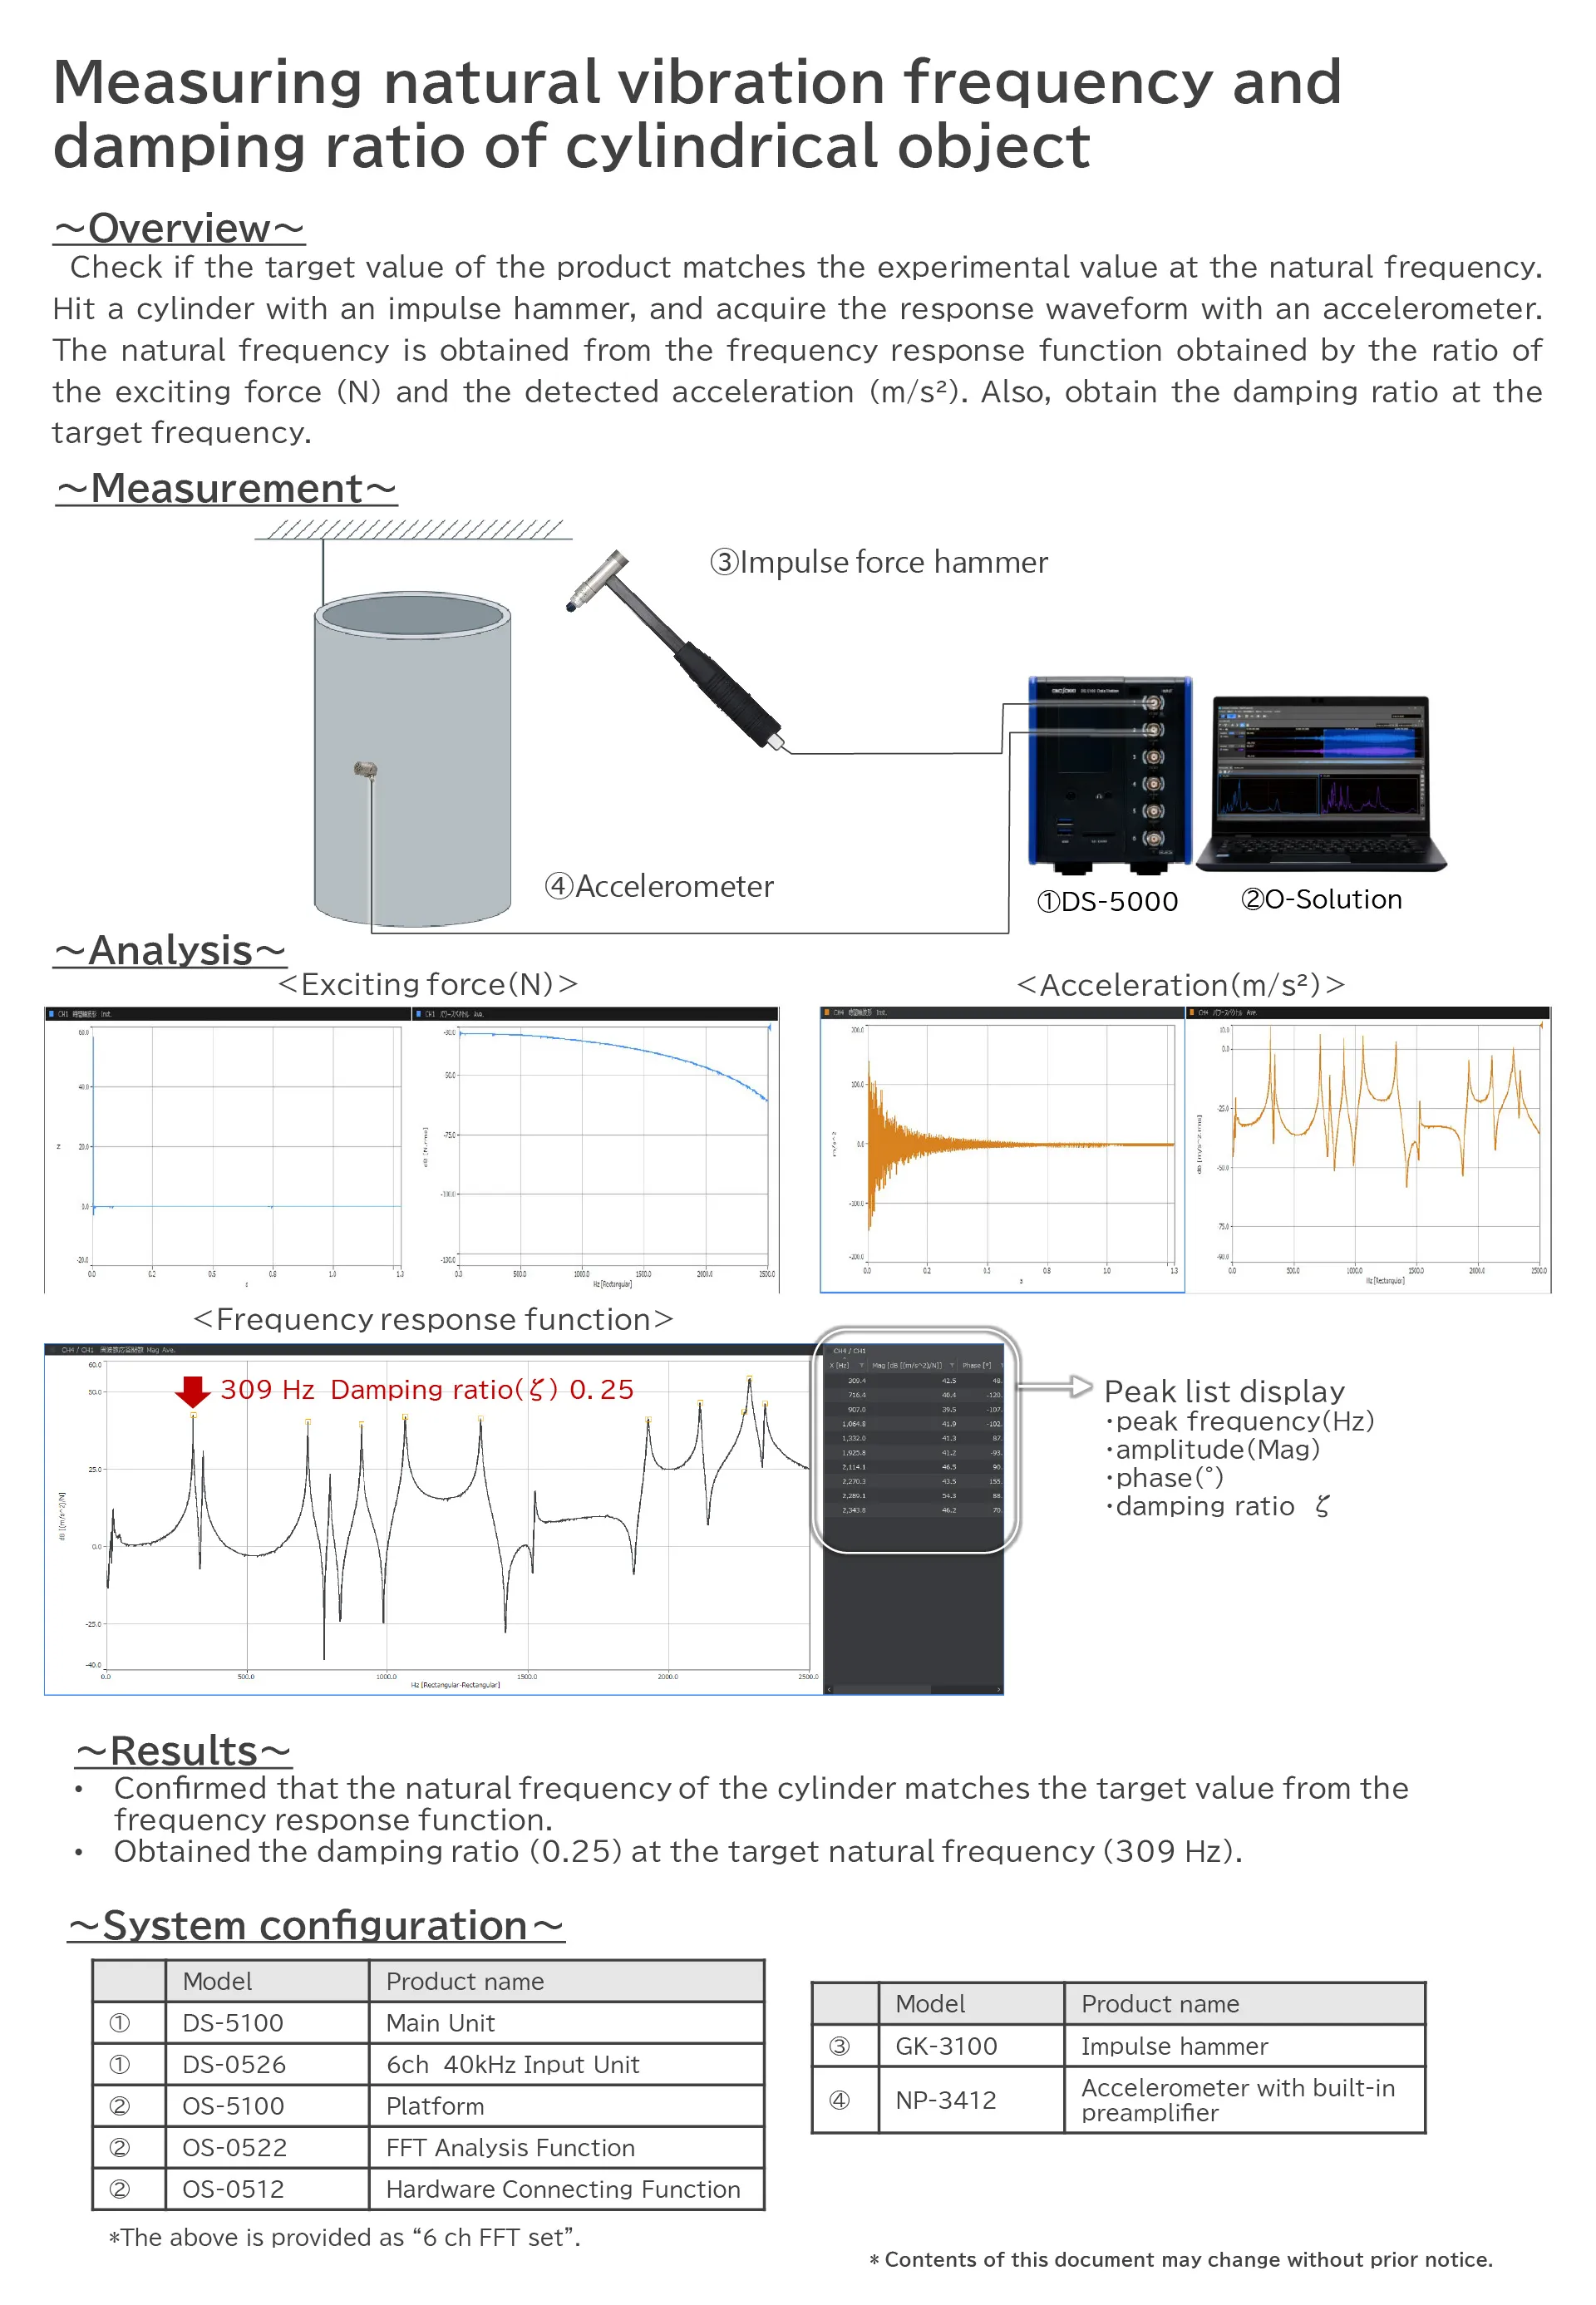
Grasp the frequency components and resonance frequencies
The most basic function used to observe the magnitude and resonance phenomena of vibration and sound in detail with analyzing the time axis wave form for each frequency components. It enables to calculate the power spectrum, frequency response function and coherence function.
Along with the FFT analysis, you can simultaneously perform the octave, tracking analysis in real time.
* For the simultaneous measurement, the Tracking analysis function (OS-0523) and Octave analysis function (OS-0524) are required.


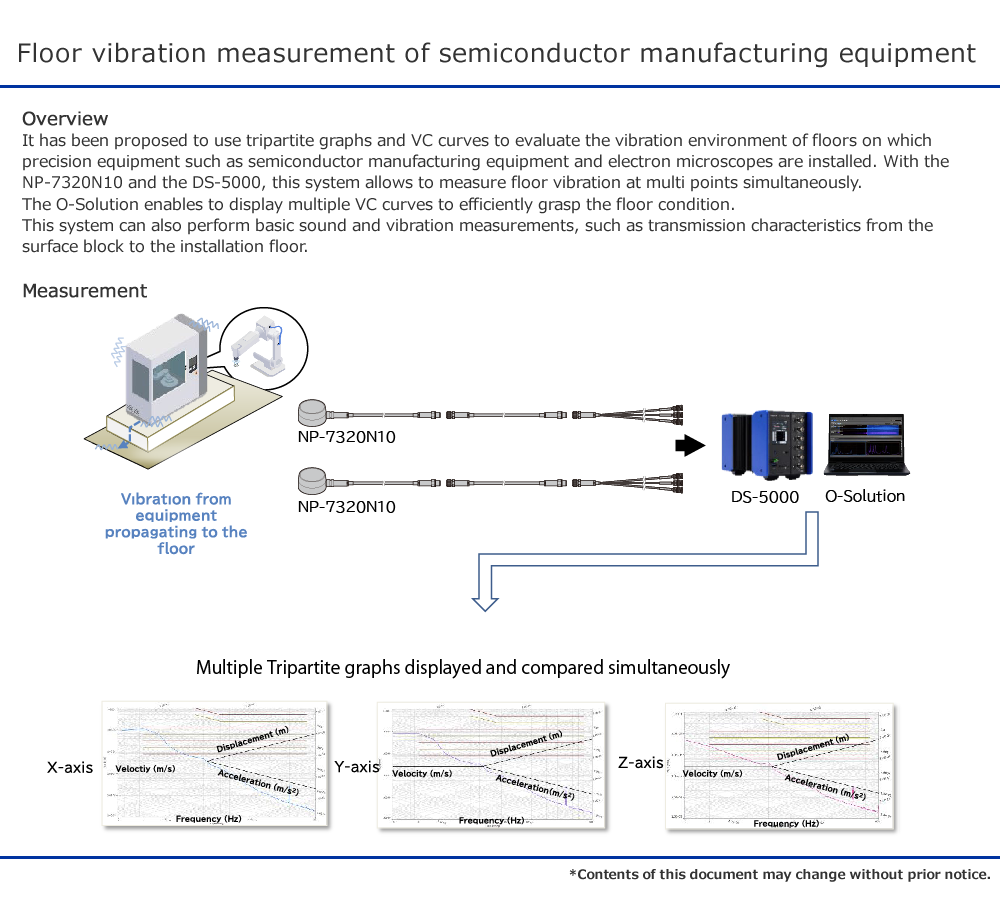
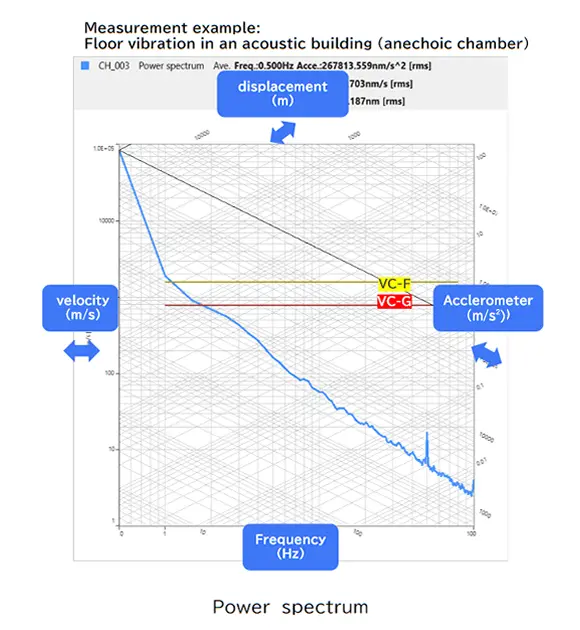
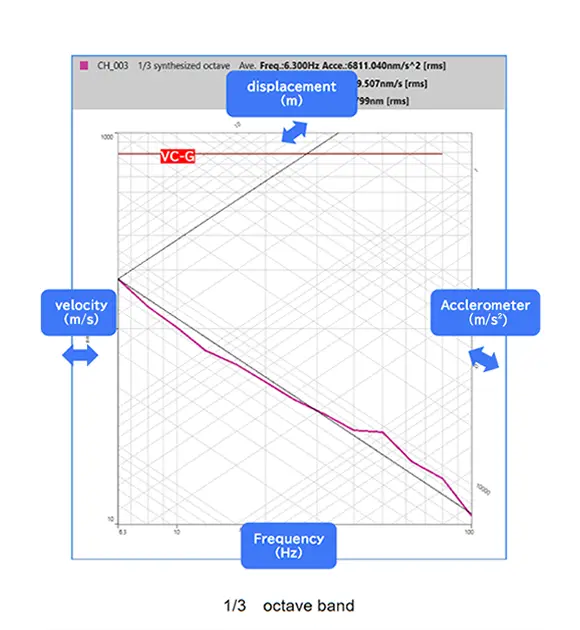
Check amplitude values such as acceleration, displacement and velocity (Tripartite graph)
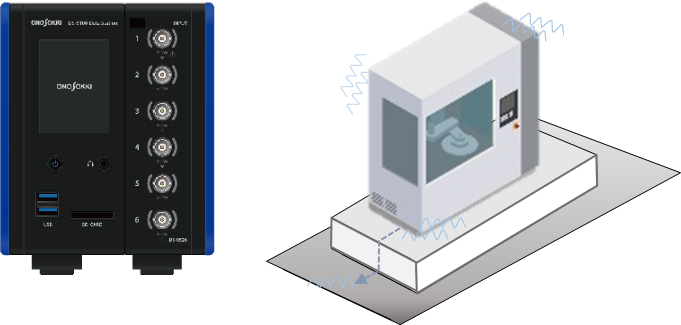
It enables to show the tripartite graph*1. Three amplitude values (acceleration (m/s2), velocity (m/s) and displacement (m)) at any arbitrary frequency can be read simultaneously in real time . It is useful for evaluating floor vibration where precision equipment is installed.
By displaying VC curves*2, allowable vibration reference or setting environment evaluation of vibration sensitive instruments, such as semiconductor manufacturing equipment, AFMs, electronic microscopes, and laser interferometers is able to be judged quickly.
*1 The tripartite graph enables you to read amplitude values of acceleration (m/s2) and displacement (m) which is based on velocity (m/s), on the frequency (Hz) axis.
*2 The VC curves (Vibration Criterion Curves) are proposed as a guidelines for allowable micro-vibrations when installing precision equipment such as semiconductor manufacturing equipment and electron microscopes. It is used in 1/3 octave bandwidth evaluation. The criteria is divided into 7 levels every 6 dB (VC-A, VC-B, VC-C, VC-D, VC-E, VC-F, VC-G ) and used as a guideline for applications such as optical microscopes or laser devices with long optical path.
Tracking Analysis Function: OS-0523
Understand the sound and vibration characteristics of rotating object
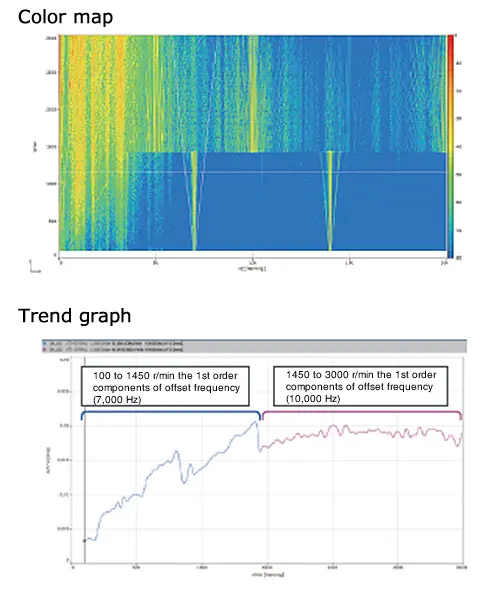
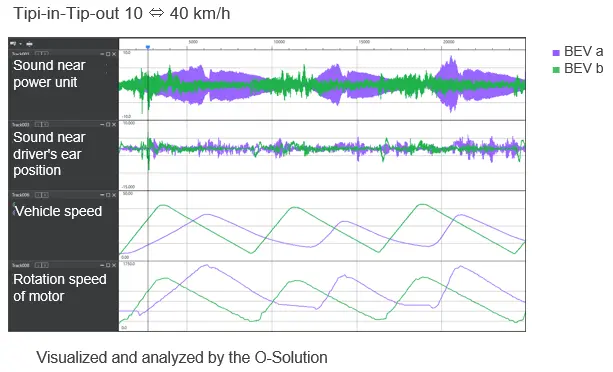
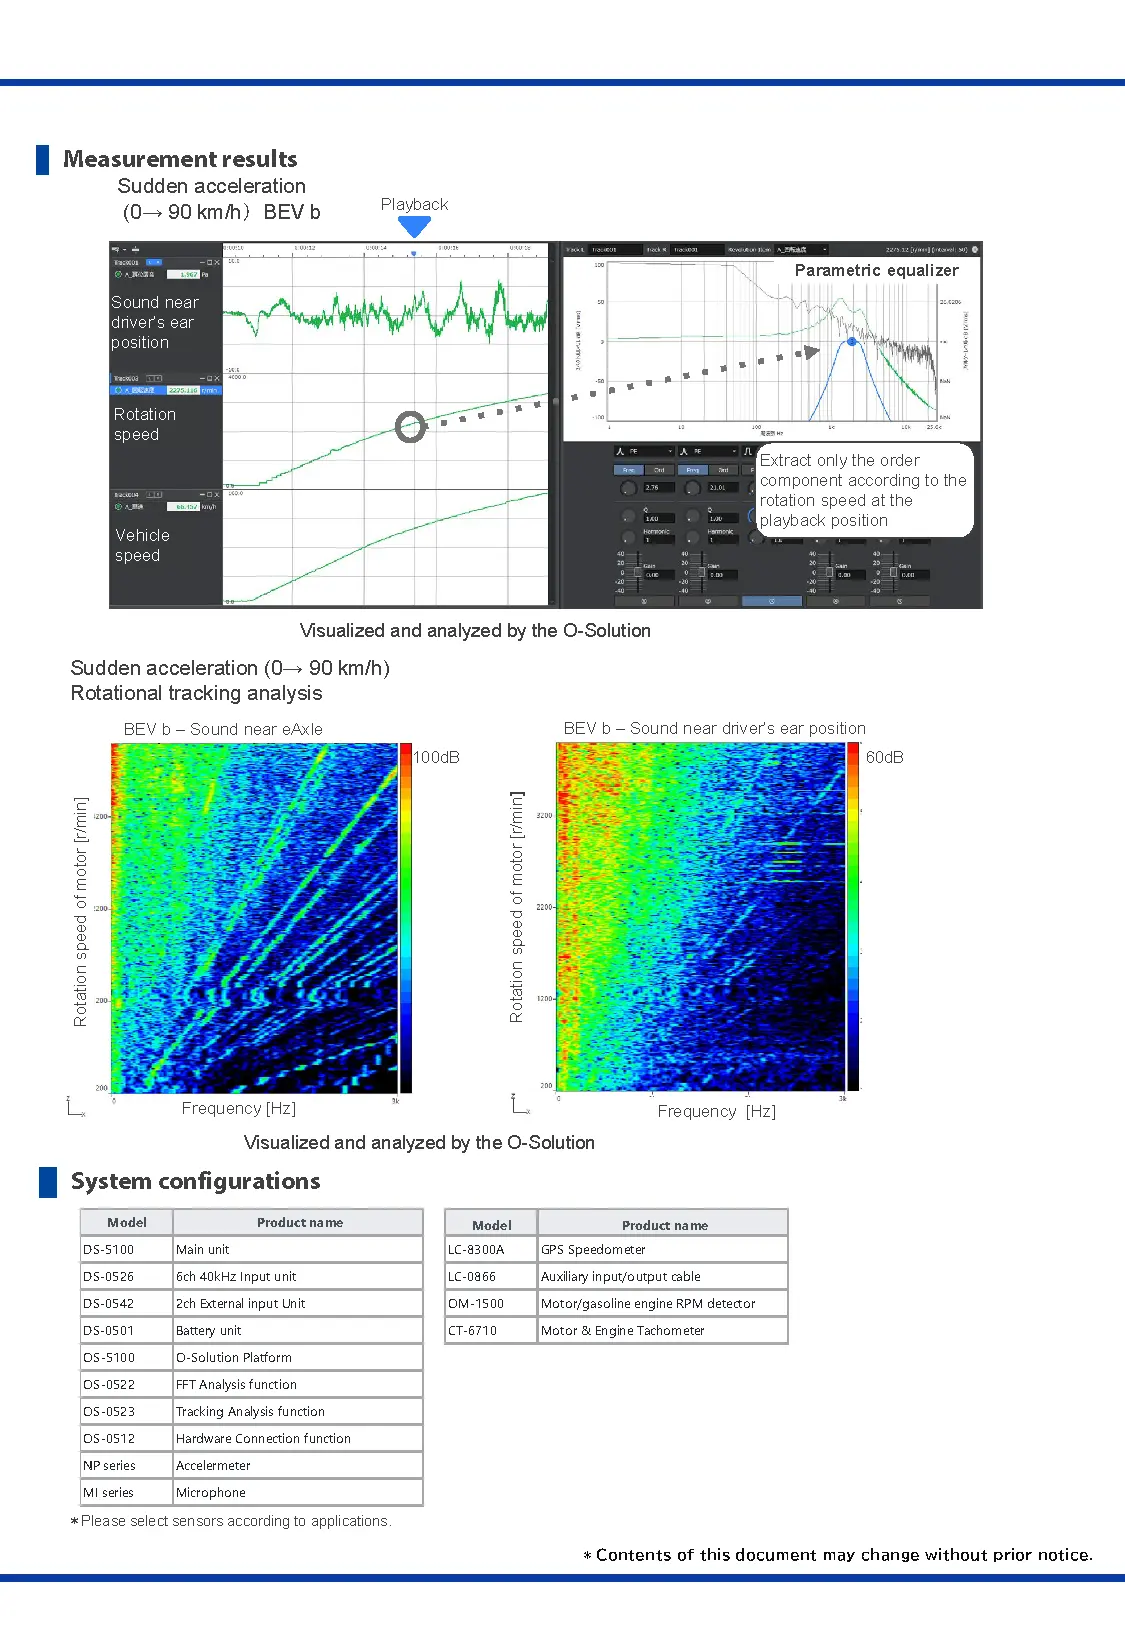
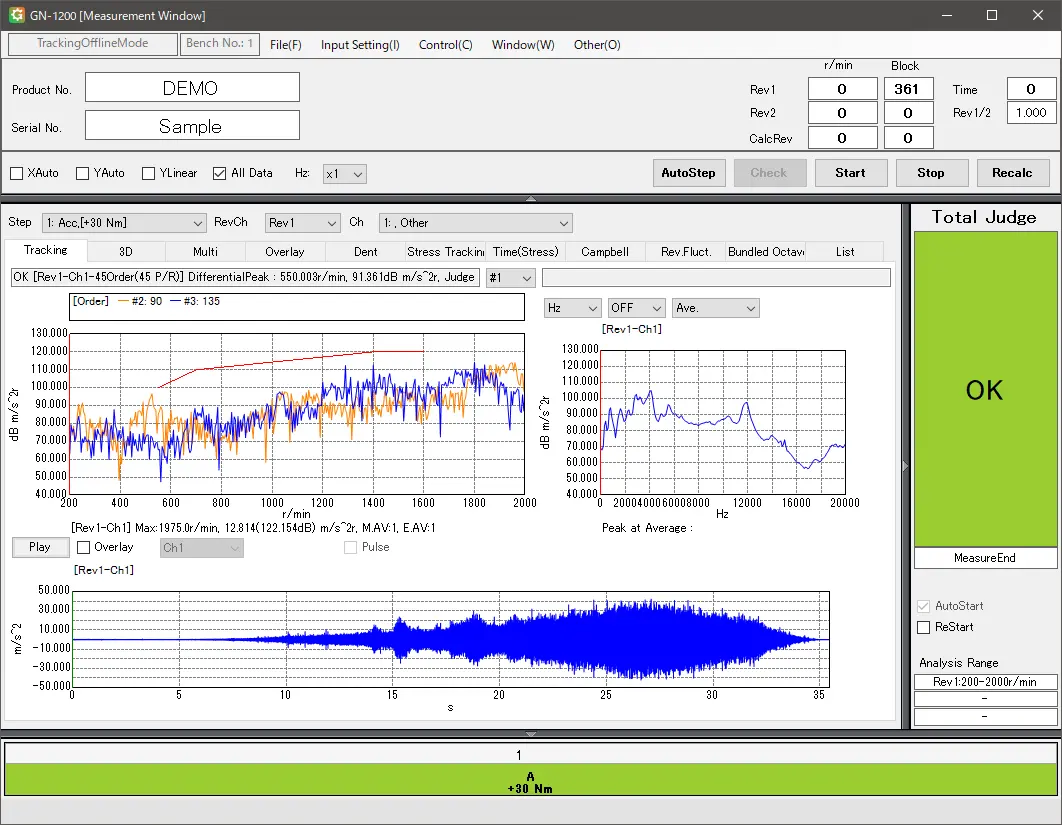
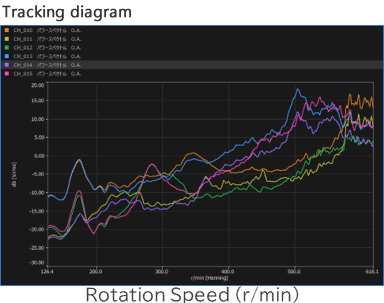
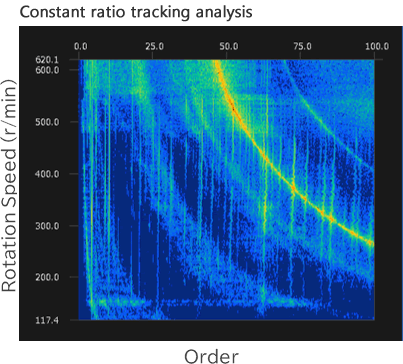
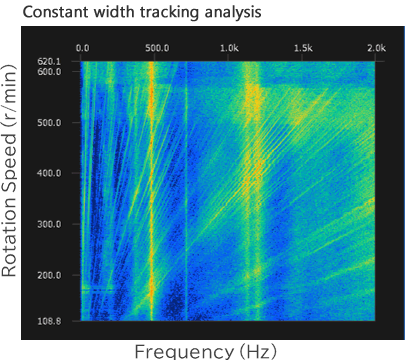
You can understand the sound and vibration generated by rotating objects such as motors and generators, and at what rotation speed each order component becomes large. Tracking analysis with constant ratio and constant width, and offset tracking are also available.
The tracking analysis and the FFT analysis can be performed simultaneously in real time.
* For the simultaneous measurement, the FFT analysis function (OS-0522).
Confirm the order trend of a rotating machine even without sweep operation
Tracking analysis data can be created by combining multiple data measured at constant rotation speed (Data integration based on rotation speed). Even if it is not sweep operation, you can efficiently specify the problematic orders over the range of rotational speed by sequentially measuring every constant rotation speed.

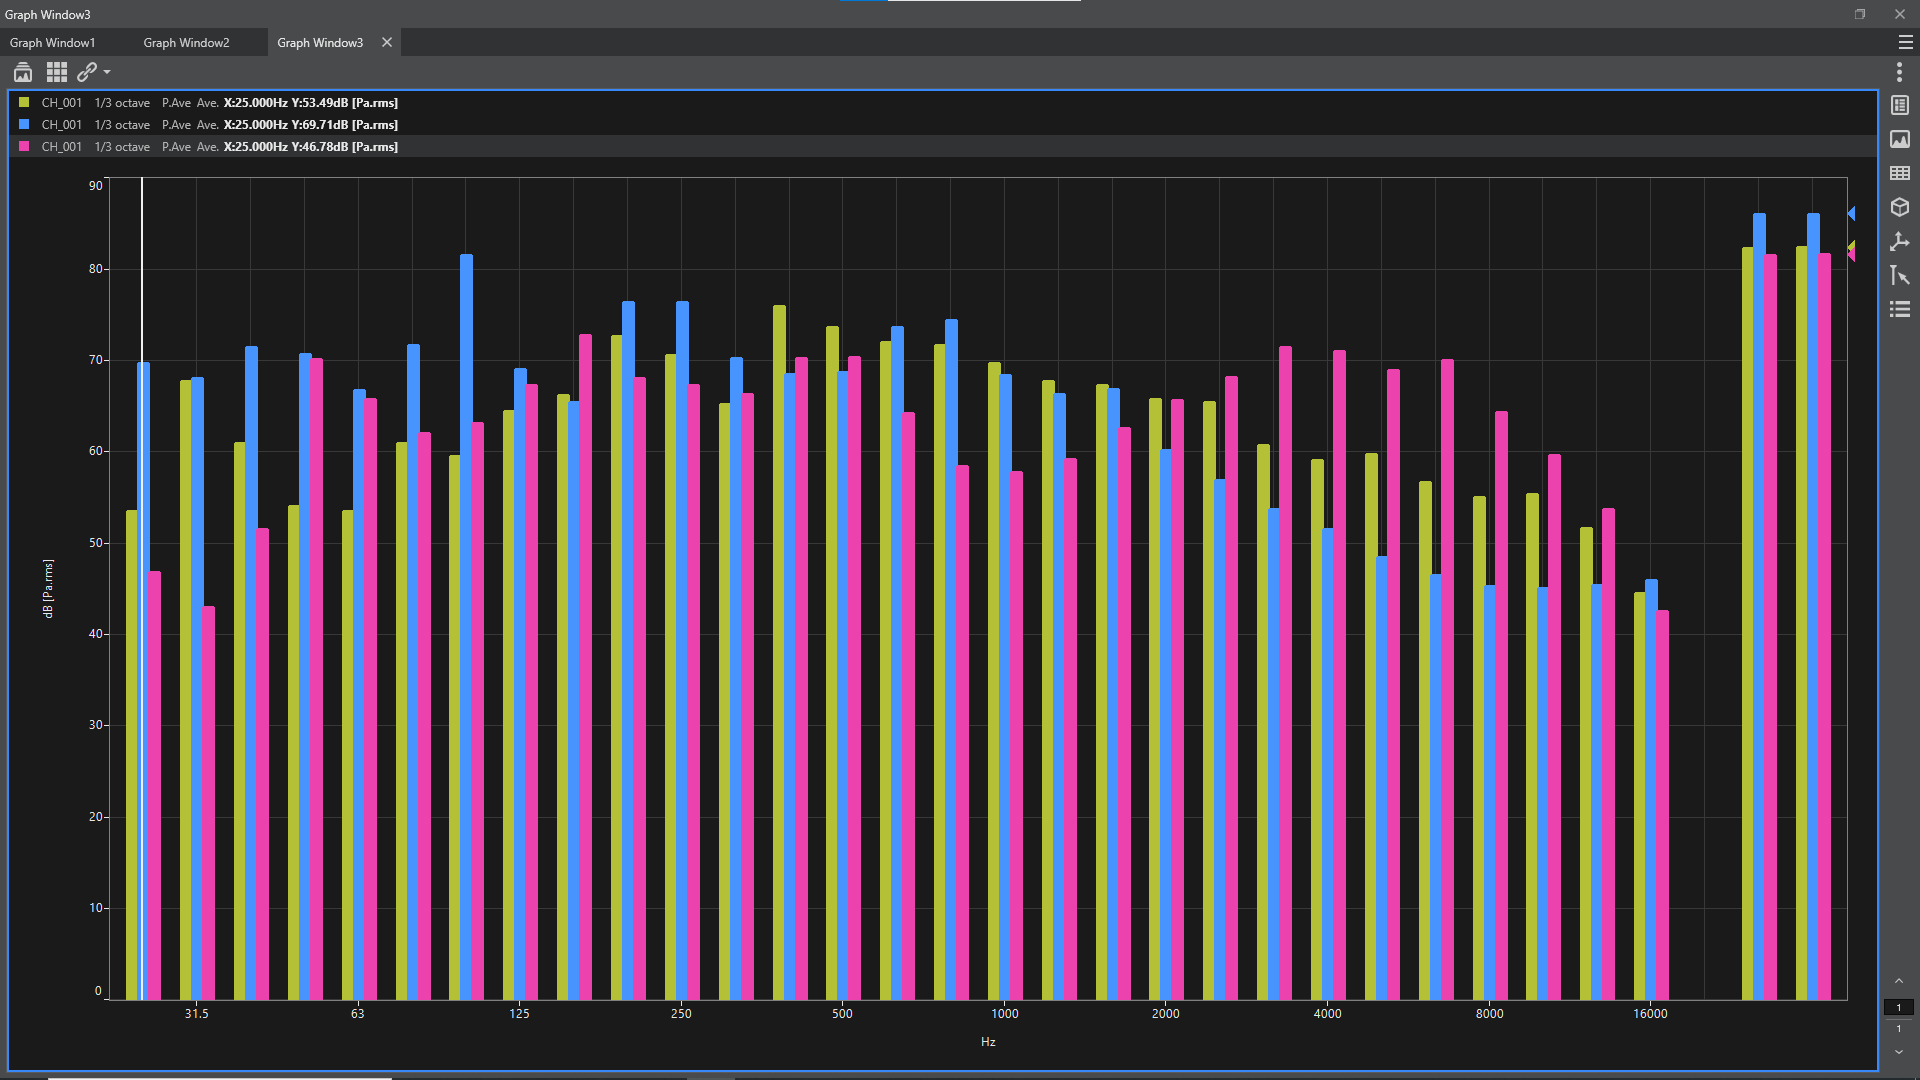
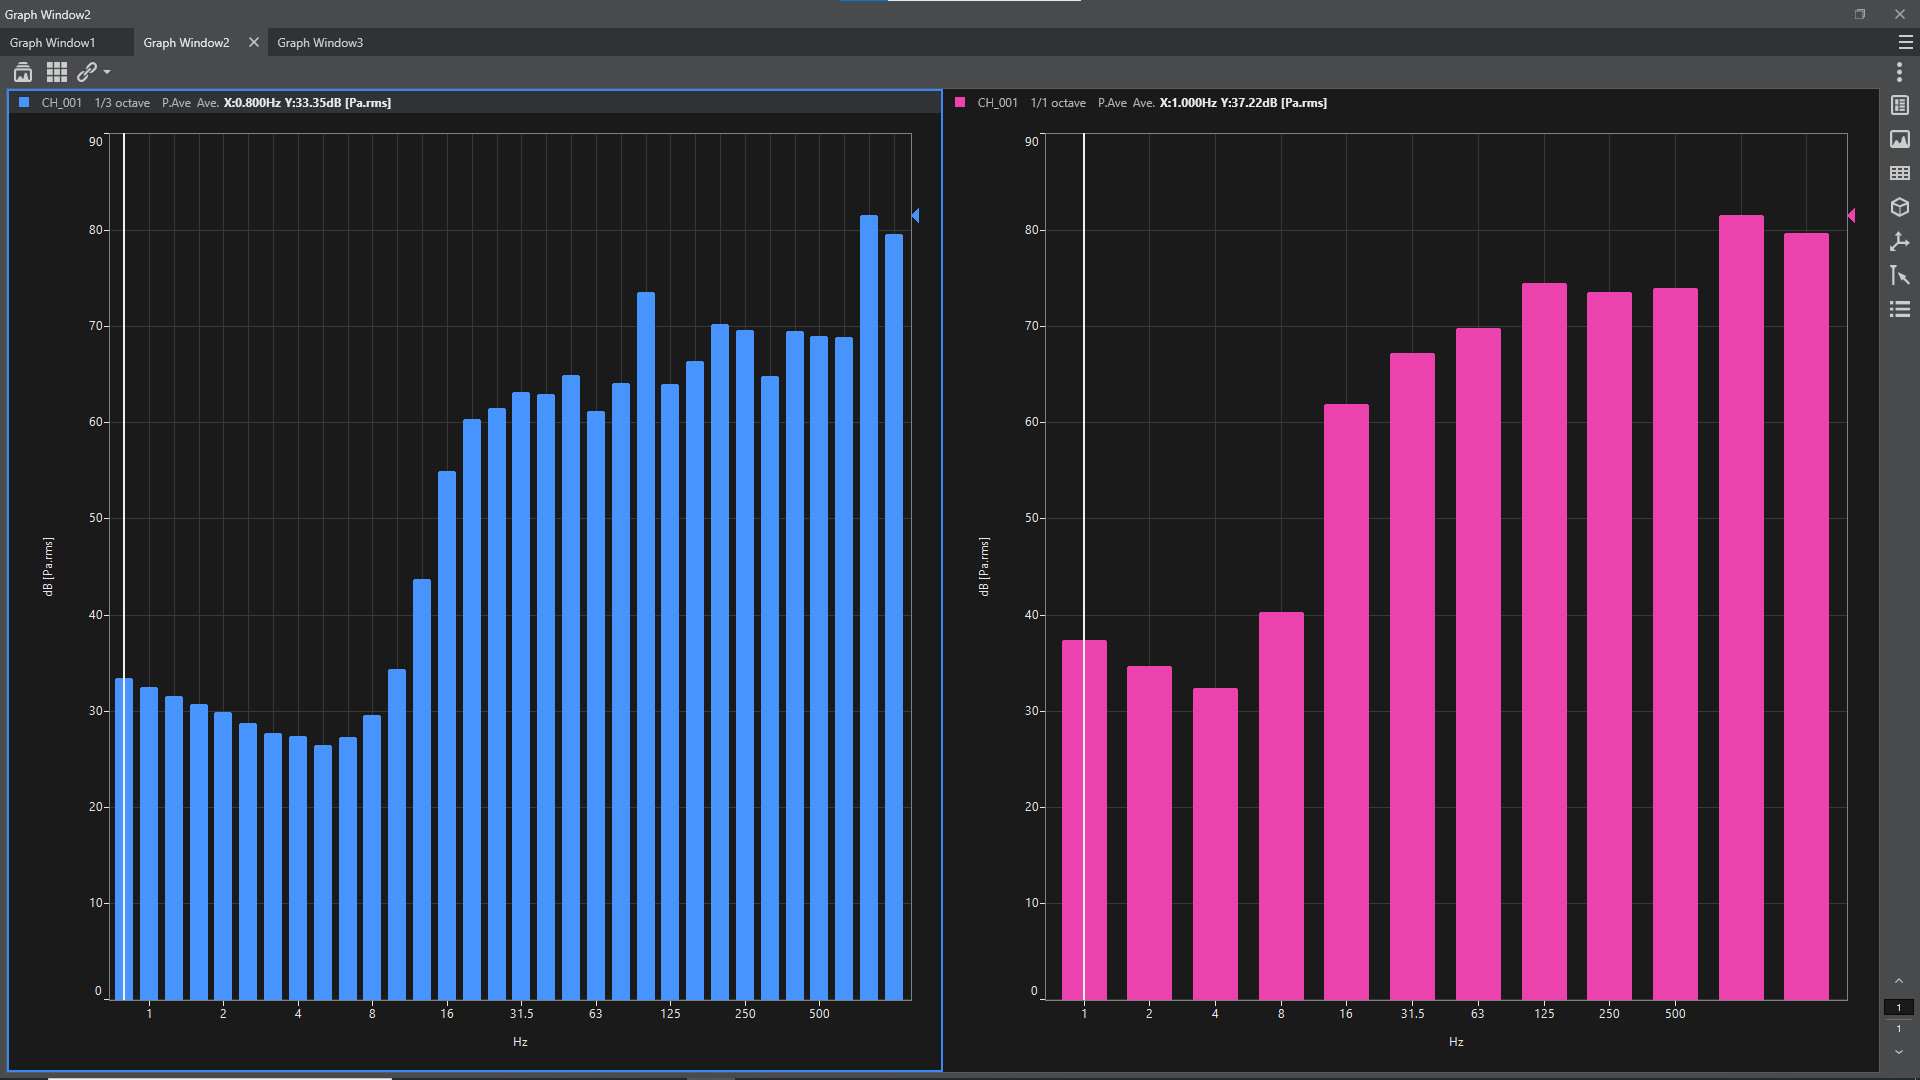
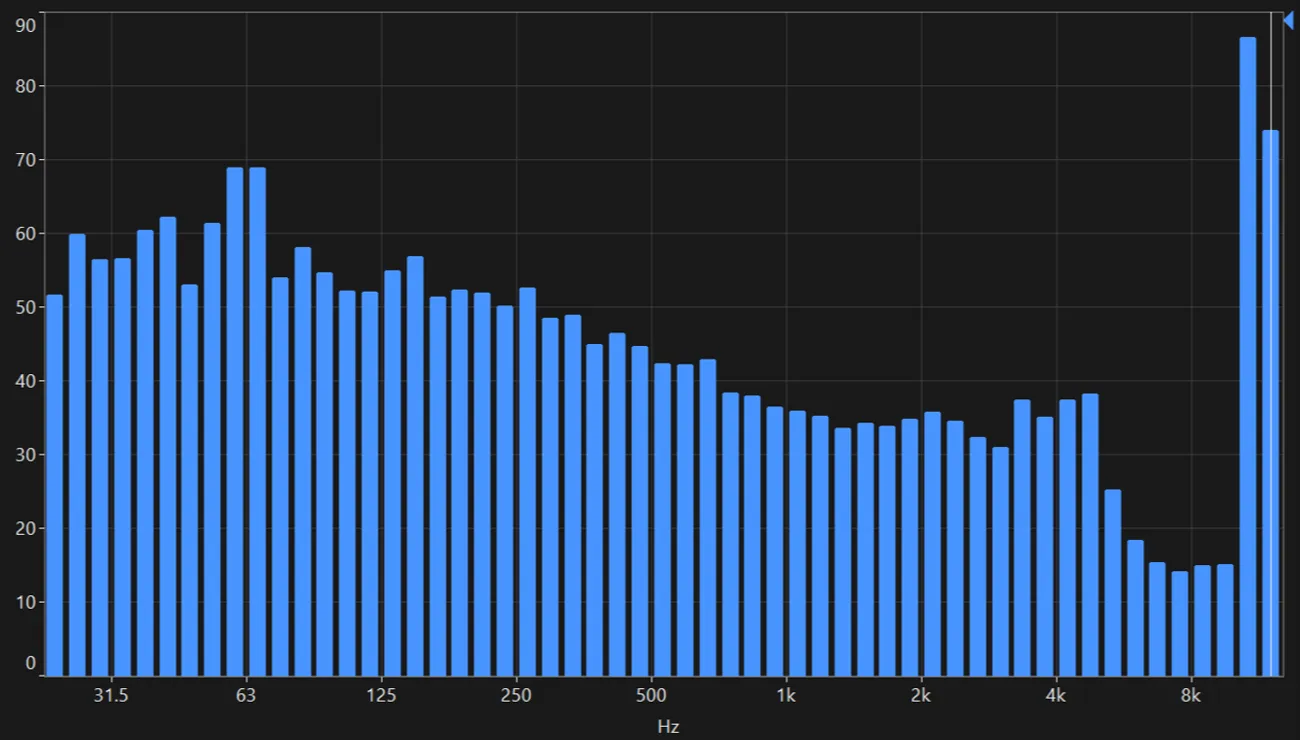
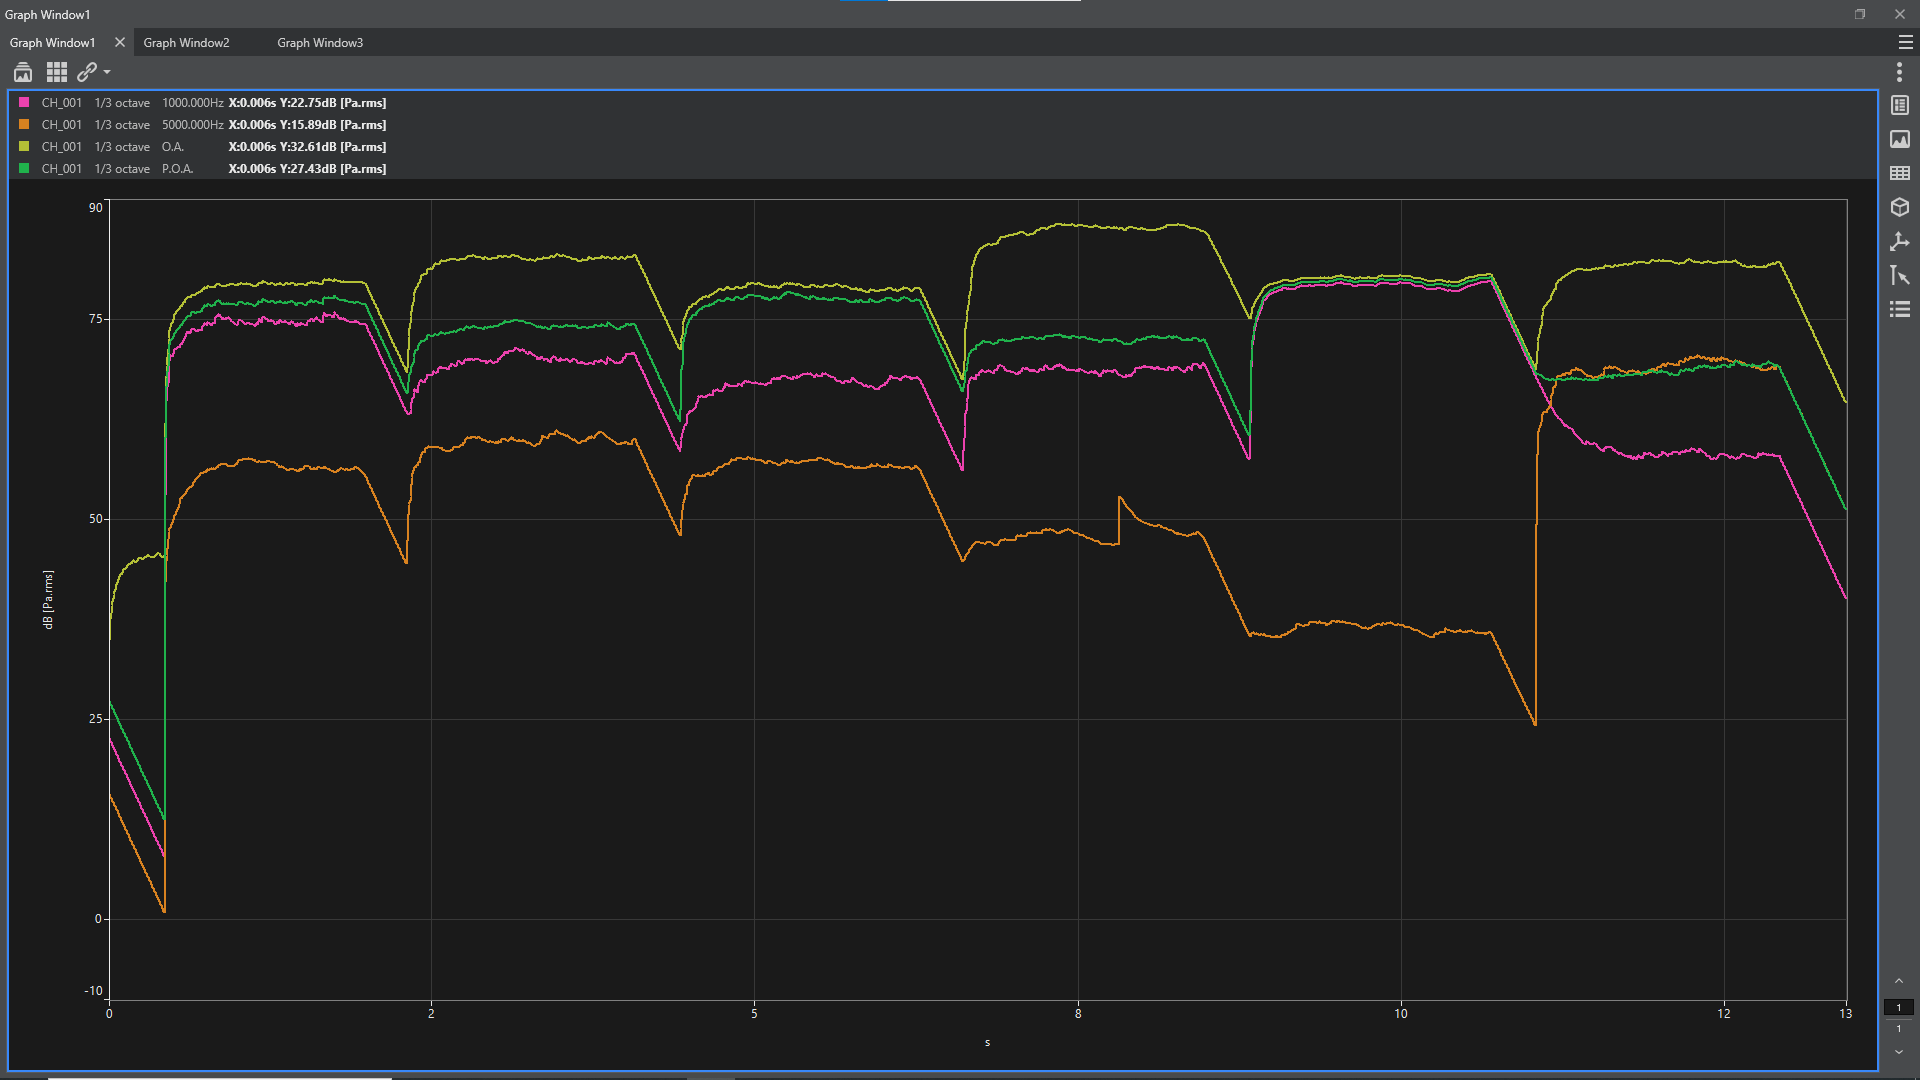
Octave Analysis Function: OS-0524
Measures environmental noise and vibration
This function is similar to the characteristics of the human ear (logarithmic (Log) to frequency) . Often used to understand noise and vibration levels and for measurements in accordance with ISO and JIS standards.
In the multiple analyses, you can simultaneously perform the FFT analysis and Octave analysis.
In measurement mode (real time measurement), 1/1, 1/3, 1/6, 1/12, 1/16, and 1/24 octave analysis is available.
Sound Power Level Using Sound Pressure: OS-0541
Conforming to standards applied to various objects
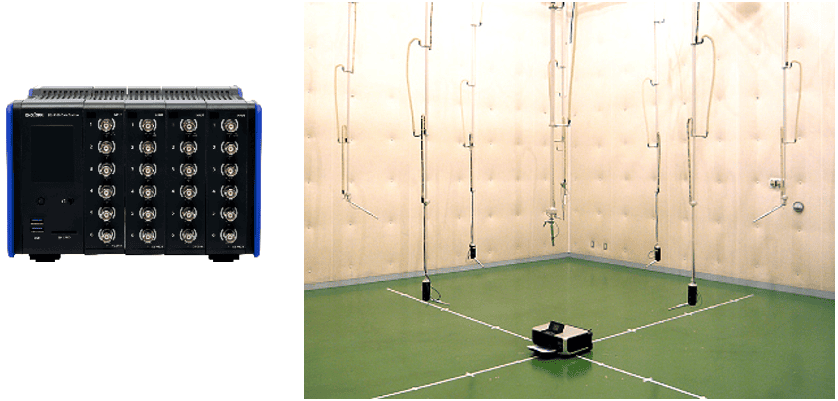
While the A-weighted Sound Pressure Level changes depending on the distance from a sound source or a test environment, the Sound Power Level is the specific value of a sound source. The measurement method is determined by international standards, and is a global indicator used in environmental labels such as Eco Mark, the Blue Angel and noise regulations. With the O-Solution /DS-5000, you can easily measure according to standards and check the sound source and frequency peaks. Thus, it allows you to take effective noise countermeasures.
Information Technology Equipment Option: OS-0542
Conforming to standards for office equipment
The measurement of noise emitted by computers, printers, multifunction devices, etc. is specified in the standard ISO 7779. This standard is also applied in obtaining environmental labels. It calculates emission sound pressure level at defined operator or bystander position as well as sound power level and the prominent discrete tones.
Sound Quality Evaluation Function: OS-0525
Sound quality evaluation considering human hearing characteristics
The sounds generated from the equipment are mainly measured by evaluation based on general analysis such as sound pressure level, FFT analysis and 1/3 Octave analysis. However, since those analysis don’t take into consideration the human hearing characteristics enough, sounds with even the same analysis result may give different impression.
When a human listens to a sound, various sensations such as loudness, sharpness, and roughness occur.
This function enables to obtain sound quality evaluation indicators that take into consideration the human hearing characteristics and correspond to various sensations of sound.
Fluctuation Sound Analysis Function: OS-0526
Evaluate the temporally fluctuating sounds
Although the magnitude of sound is not so large, there are many “unpleasant sounds” in the world.
For example, “rattling” and “humming“ sounds generated from interior parts while driving a car, or abnormal sounds such as “buzzing“ sounds that can be heard in the rotation sound of a small motor, etc. Sounds with significant temporal fluctuations often feel unpleasant even if the magnitude of sound(level) is not so large. The Fluctuation Sound Analysis Function enables to extract only the components with large temporal fluctuations that are not affected by the level. As a result, it can quantify the characteristics of various temporal fluctuations that were difficult to detect with roughness or fluctuation strength. In addition, it is equipped with a function to compare the sound with fluctuation and the sound without fluctuation.
(Fluctuation sound simulator)
Time Frequency Analysis Function: OS-0527
Evaluate transient phenomena
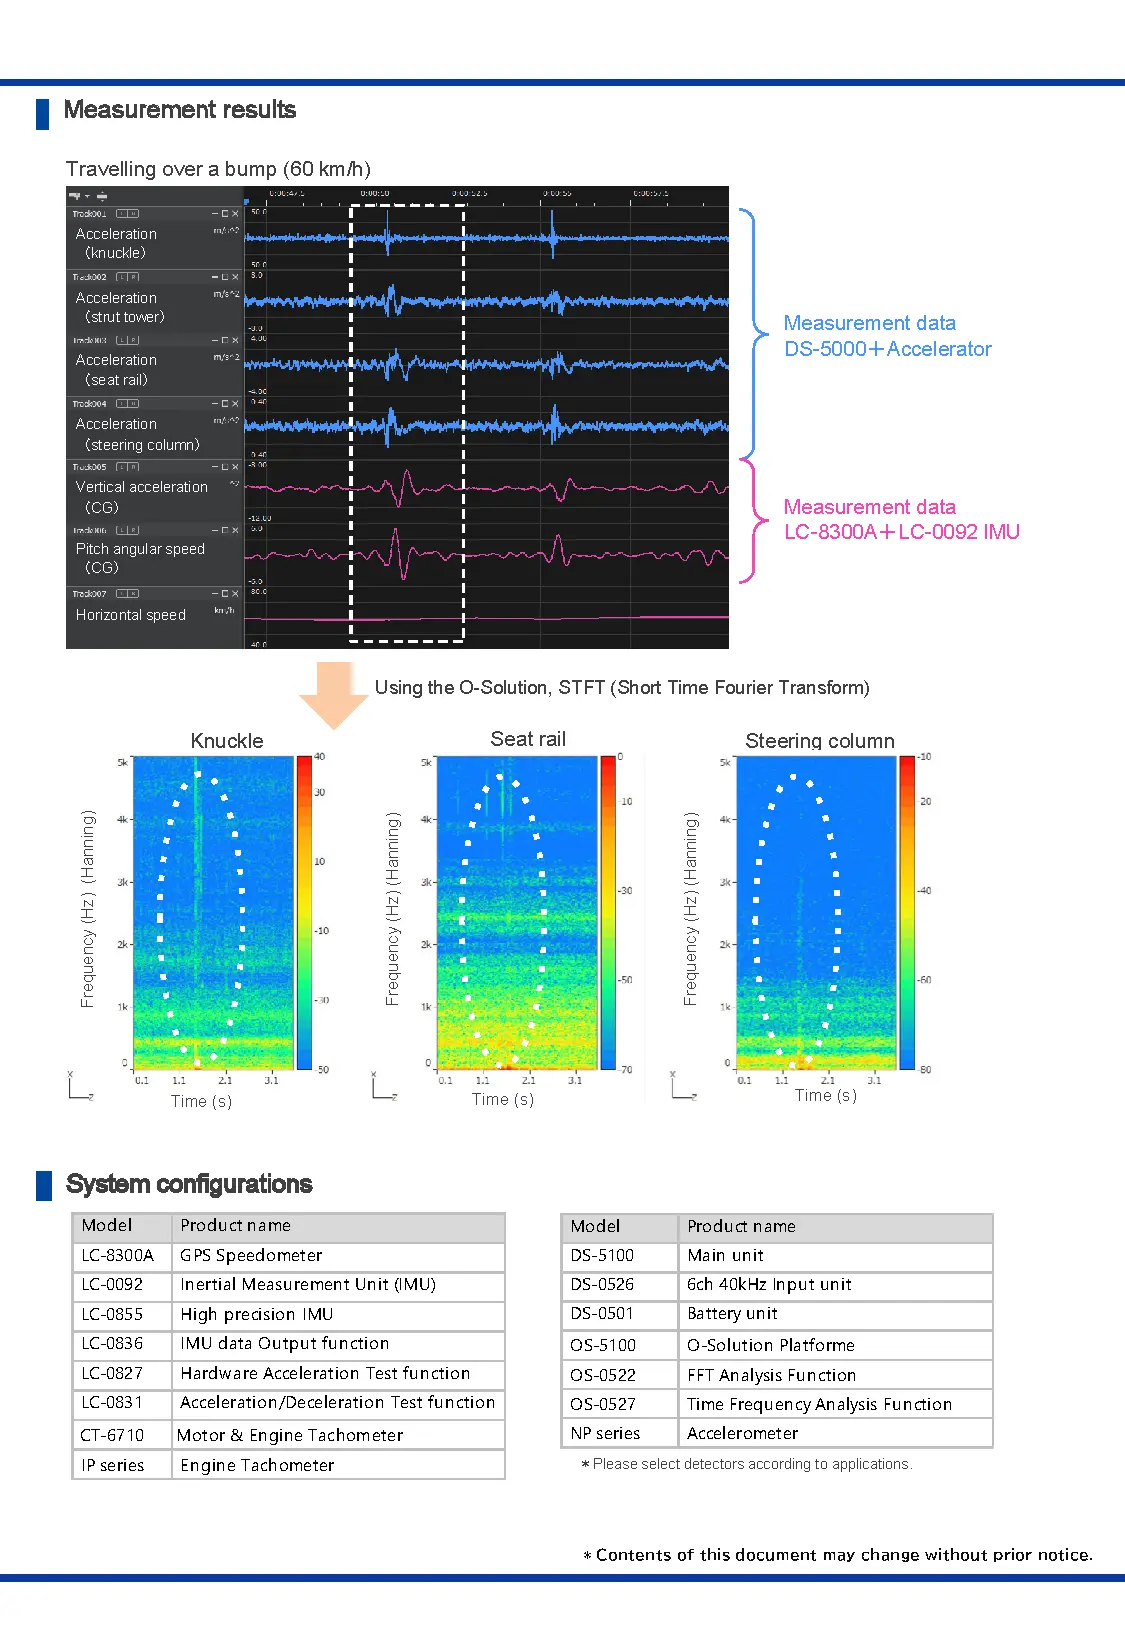
This function can evaluate transient phenomena that were difficult to capture by FFT analysis and display clearly time change of the frequency components while maintaining its frequency resolution. It is equipped with STFT (Short Time Fourier Transform) and Wavelet transform.
Statistical Analysis Function: OS-0531
Various statistical analyses in one window
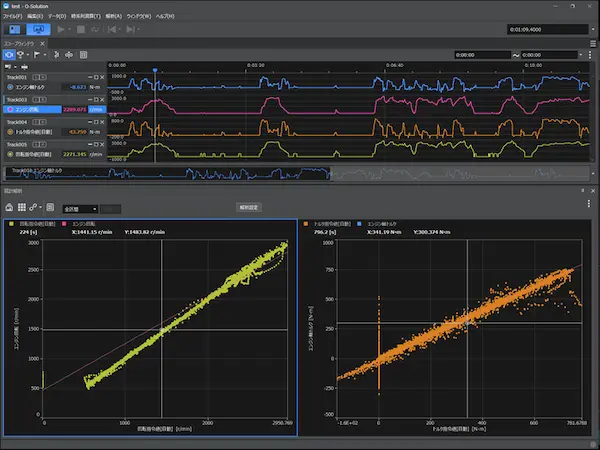
By performing bivariate analysis of the command value and feedback value, various statistical analyzes such as obtaining correlation coefficient can be performed in one window.
Basic statistical analysis
Histogram, autocorrelation function, normal probability plot
Bivariate analysis
Scatter plot, cross-correlation function, stereogram, interval statistics
3-variable analysis
3D scatter plot, 3D interval statistics
Video Playback Function: OS-0532
Understand phenomena by observing the behavior of the target object
Video files recorded with a video camera or smartphone can be loaded into the O-Solution and played back along with analysis results of sound, vibration, etc.
By displaying video, time series data, FFT analysis results, etc. side by side, you can determine which part of the target object's behavior is causing a problem.
Furthermore, for example, audio data from smartphones sent by field workers can also be utilized for frequency analysis.
*Audio data obtained from smartphones cannot be calibrated or converted to accurate decibel (dB) values without calibration data. The amplitude values should be treated as reference values only.

Supported video file formats: avi / mp4 / mov / wmv / m4a
* Video data can be rotated vertically or horizontally (fine adjustments are also possible).
* If the start positions of the data recorded with the DS-5000 and the video data are misaligned,
you can align the positions of each data by using the time series position alignment function.
*For details regarding supported codecs, please refer to the specifications.
External Control Function: OS-0510
External data control of O-Solution from user's application
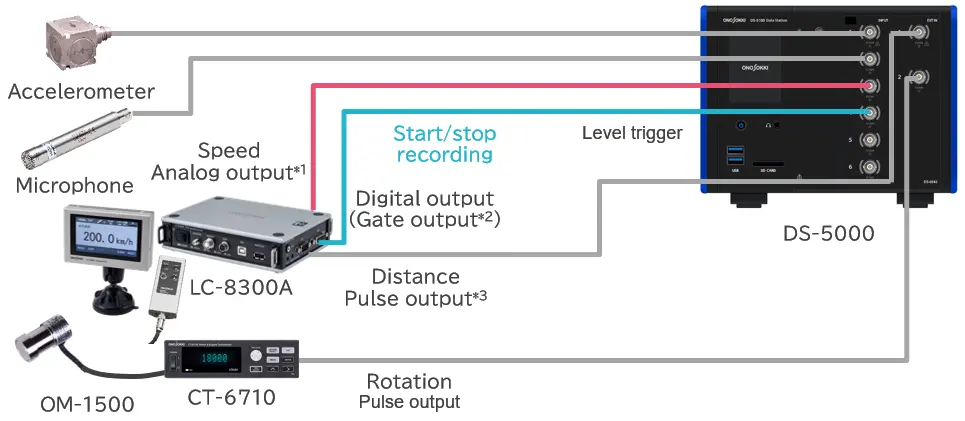
Using the library for external control function (O-Step API), the O-Solution can be controlled from the user's application(*) via TCP/IP.
Sound and vibration data can be automatically imported into the user's system.

Example1:
Automation of repetitive tasks such as sound and vibration data acquisition
You can automatically measure, analyze and save huge data.
Example2:
Periodic and automatic NV evaluation of test equipment
*Support program languages
C#, Python, MATLAB, LabVIEW, C++, VBA
DS-5000 Hardware Control Library: DS-0511
Control the DS-5000 directly
Time series data etc. can be acquired in real time without going through the O-Solution.
If you are interested, please contact us.
Hardware Connection: OS-0512
Perform real-time analysis
By using the OS-0512 Hardware Connection Function, FFT analysis, tracking analysis, Octave analysis are available in the measurement mode.
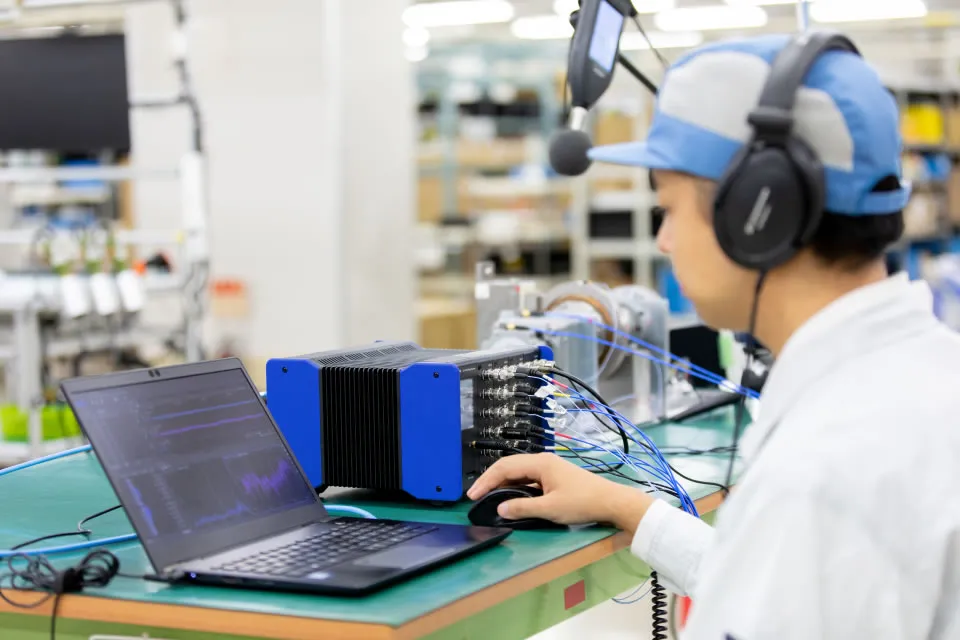
The DS-5000 series Data Station can be connected to a personal computer that meets the following specification conditions.
Specifications
| Common specifications | |
| Mandatory interface | LAN terminal 1000base-T, TCP/IPv6 |
|---|---|
| OS | Microsoft® Windows® 10 Pro (64 bit) Microsoft® Windows® 11 Pro (64 bit) Microsoft® Windows® 11 Enterprise LTSC (64 bit)
|
| Mandatory software |
.NET Core 3.1 Desktop Runtime (Up to Ver .2.1.7)
|
| Optical drive | DVD-R
|
| Recommended specification 1: For the measurement / recording with 96 channels or less | |
| CPU | Intel® Core™ processor ( Intel® CoreTM i7 or higher grade, and 8th Generation or later generation)
|
| Memory | Minimum 16 GB |
| Storage | Minimum free space 32 GB
|
| Display | Minimum 1920 x 1080 |
| Recommended specification 2: For the measurement / recording with 96 channels or more | |
| CPU | Intel® Core™ processor ( Intel® CoreTM i7 or higher grade, and 8th Generation or later generation)
|
| Memory | Minimum 16 GB |
| Storage | Minimum free space 32 GB
|
| Display | Minimum 1920 x 1080 |
| Minimum specification | |
| CPU | Intel® Core™ processor ( Intel® CoreTM i5 or higher grade, and 8th Generation or later generation)
|
| Memory | Minimum 8 GB |
| Storage | Minimum free space 16 GB
|
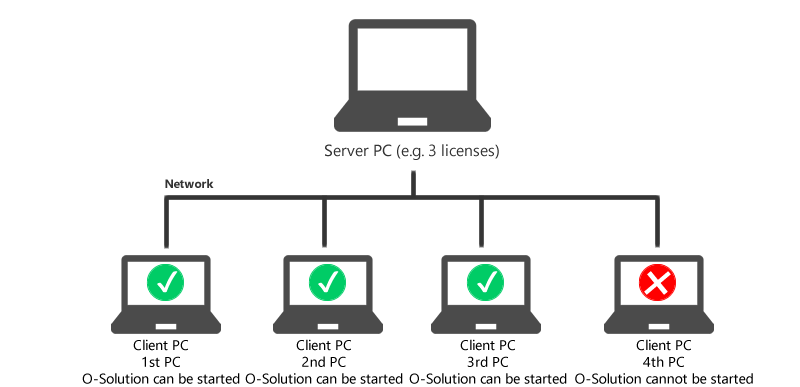
Recommended specifications for PC server (Network license)
| Recommended hardware | |
|---|---|
| CPU | 1.6 GHz or more (Intel Xeon series) |
| Memory | Minimum 8 GB |
| Hard disc | 100 GB or more free space |
| Optical drive | DVD (for installation) |
| Software requirement | |
| OS (64bit) | Windows Server 2019 |
| Windows Server 2016 | |
| Mandatory software | .NET Core 6.0 Desktop Runtime |

