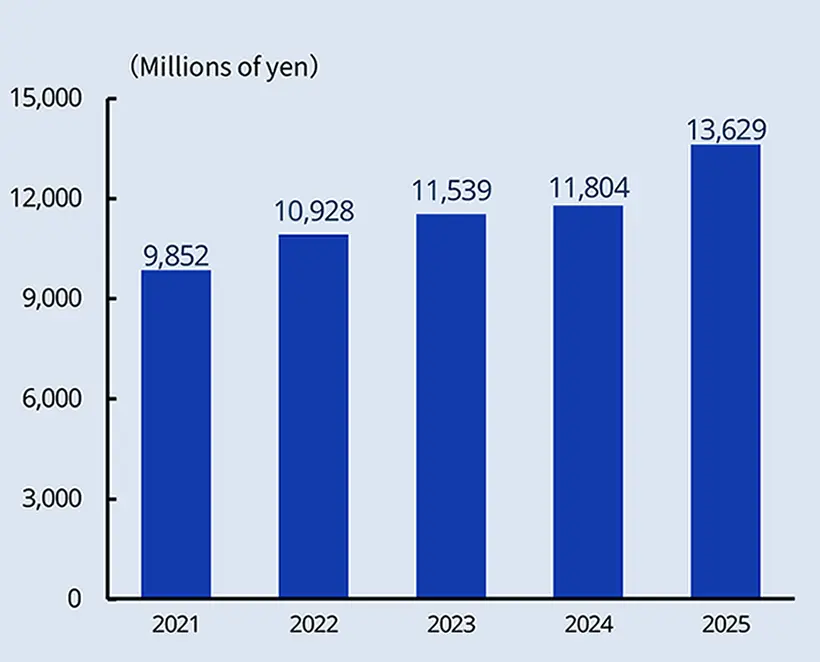
Net sales
(Millions of yen)
|
13,629 |
11,804 |
11,539 |
10,928 |
9,852 |
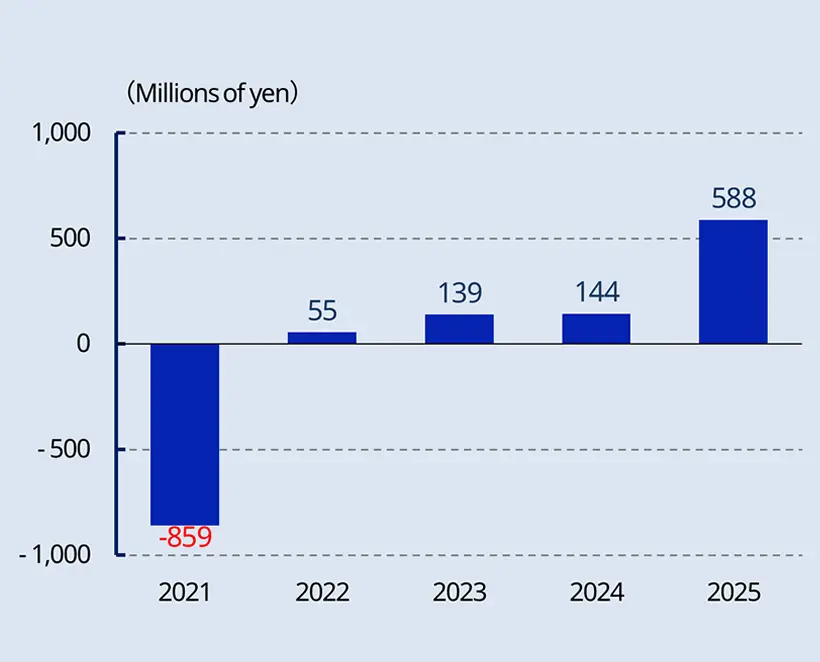
Operating profit
(Millions of yen)
|
588 |
144 |
139 |
55 |
-859 |
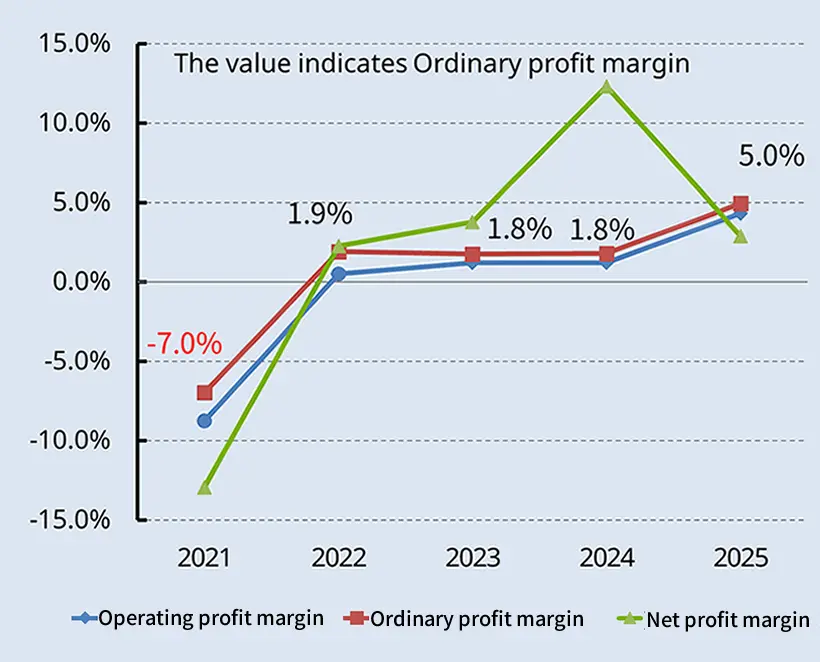
Operating profit margin
(%)
|
4.3 |
1.2 |
1.2 |
0.5 |
-8.7 |
Ordinary profit
(Millions of yen)
|
679 |
212 |
204 |
211 |
-685 |
Ordinary profit margin
(%)
|
5.0 |
1.8 |
1.8 |
1.9 |
-7.0 |
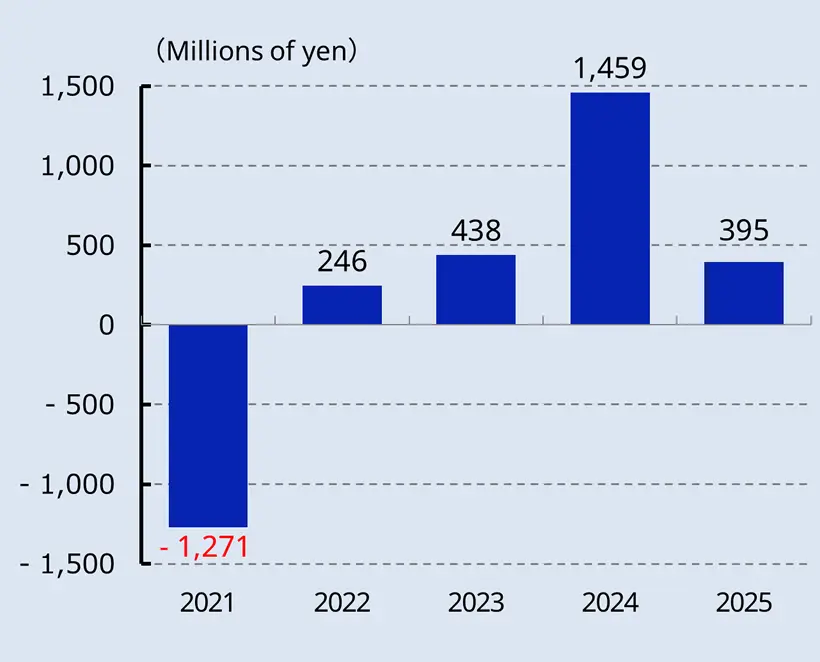
Profit attributable to owners of patent
(Millions of yen)
|
395 |
1,459 |
438 |
246 |
-1,271 |
|
2.9 |
12.4 |
3.8 |
2.3 |
-12.9 |
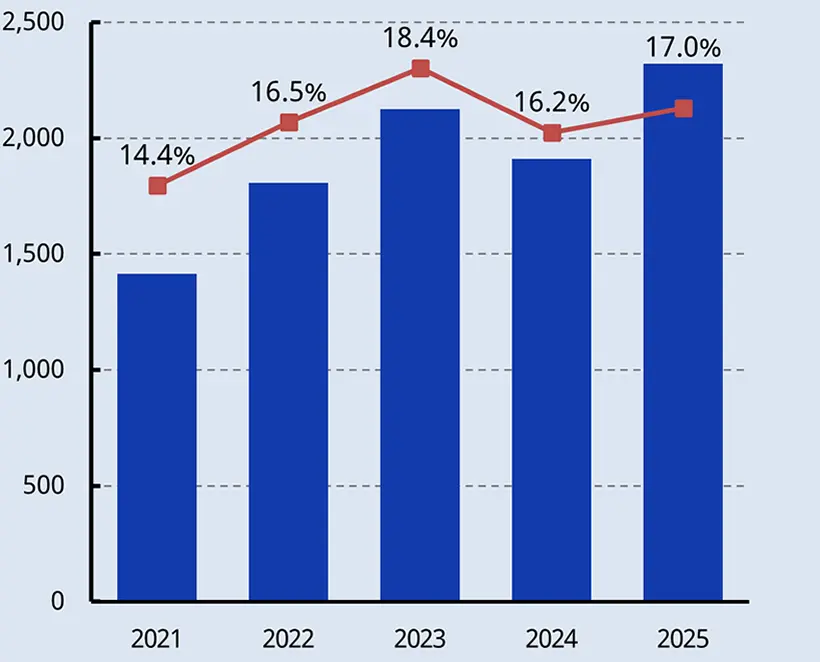
Overseas sales
(Millions of yen)
|
2,321 |
1,911 |
2,125 |
1,808 |
1,415 |
|
17.0 |
16.2 |
18.4 |
16.5 |
14.4 |
Total assets
(Millions of yen)
|
21,783 |
21,309 |
21,003 |
21,109 |
19,446 |
Net assets
(Millions of yen)
|
16,603 |
15,914 |
14,110 |
13,386 |
12,720 |
Equity-to asset ratio
(%)
|
74.5 |
73.3 |
65.8 |
62.0 |
64.1 |
Rate of return on equity
(%)
|
2.5 |
9.9 |
3.3 |
1.9 |
- |
Earnings per Share
(EPS, yen)
|
38.00 |
138.77 |
41.68 |
23.82 |
-114.67 |
Book Value per Share
(BPS, yen)
|
1,557.72 |
1,511.83 |
1,307.93 |
1,262.78 |
1,206.19 |
Payout ratio (Consolidated)
(%)
|
57.9 |
21.6 |
24.0 |
21.0 |
- |
Cash flows from operating activities
(Millions of yen)
|
594 |
330 |
340 |
-230 |
-498 |
Cash flows from investing activities
(Millions of yen)
|
-584 |
3,948 |
431 |
-160 |
-2 |
Cash flows from financing activities
(Millions of yen)
|
-530 |
-2,273 |
-984 |
569 |
-374 |
Cash and cash equivalents at end of period
(Millions of yen)
|
3,774 |
4,240 |
2,118 |
2,276 |
2,026 |
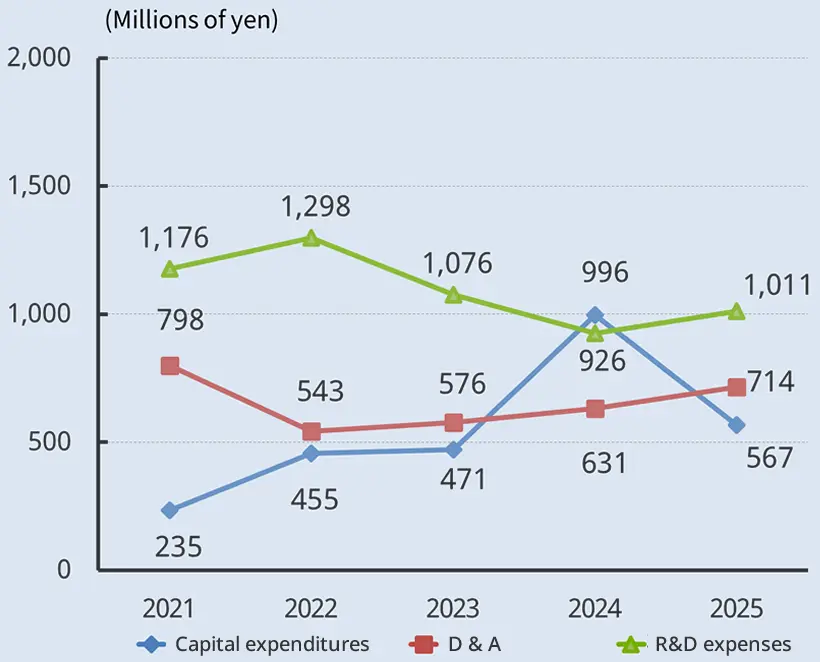
Capital expenditures
(Millions of yen)
|
567 |
996 |
471 |
455 |
235 |
Depreciation and Amortization
(Millions of yen)
|
714 |
631 |
576 |
543 |
798 |
R&D expenses
(Millions of yen)
|
1,011 |
926 |
1,076 |
1,298 |
1,176 |