Sound Quality Evaluation Function OS-0525
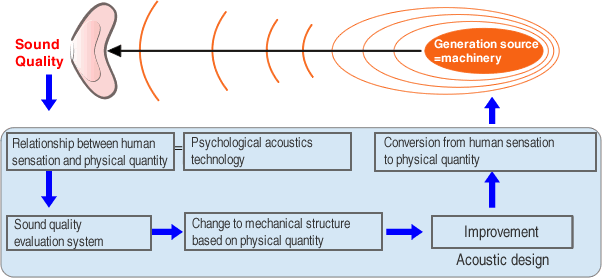
Sound quality evaluation considering human hearing characteristics
The sounds generated from the equipment are mainly measured by evaluation based on general analysis such as sound pressure level,
FFT analysis and 1/3 Octave analysis. However, since those analysis don’t take into consideration the human hearing characteristics enough,
sounds with even the same analysis result may give different impression.
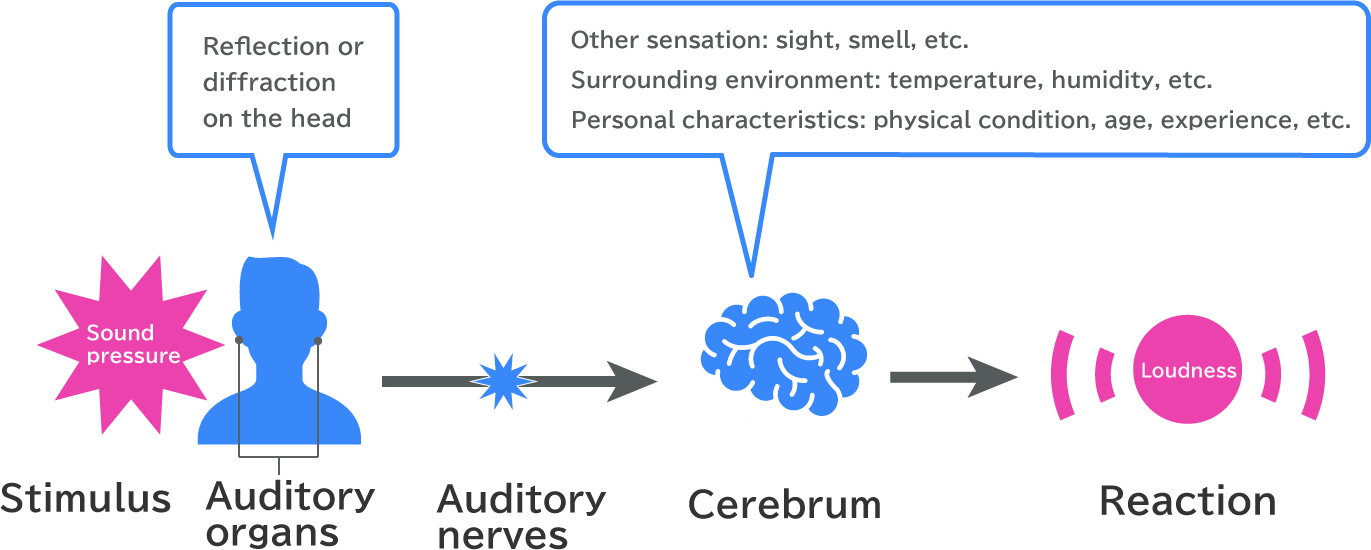
When a human listens to a sound, various sensations such as loudness, sharpness, and roughness occur.
This function enables to obtain sound quality evaluation indicators that take into consideration the human hearing characteristics and correspond to various sensations of sound.
Applicable standards
Loudness of stationary sounds (ISO532-1)
Loudness of non-stationary sounds (ISO532-1)
TNR/PR(ISO7779 Annex D)
Parameters for sound quality evaluation
Loudness (Loudness of sound)
Sharpness (High-pitched sound)
Tonality (Feeling of pure tones)
Roughness (Roughness, rasping)
Fluctuation strength (Fluctuating feeling)
TNR/PR (Discrete tone)
Analysis example for 6 mechanical sounds
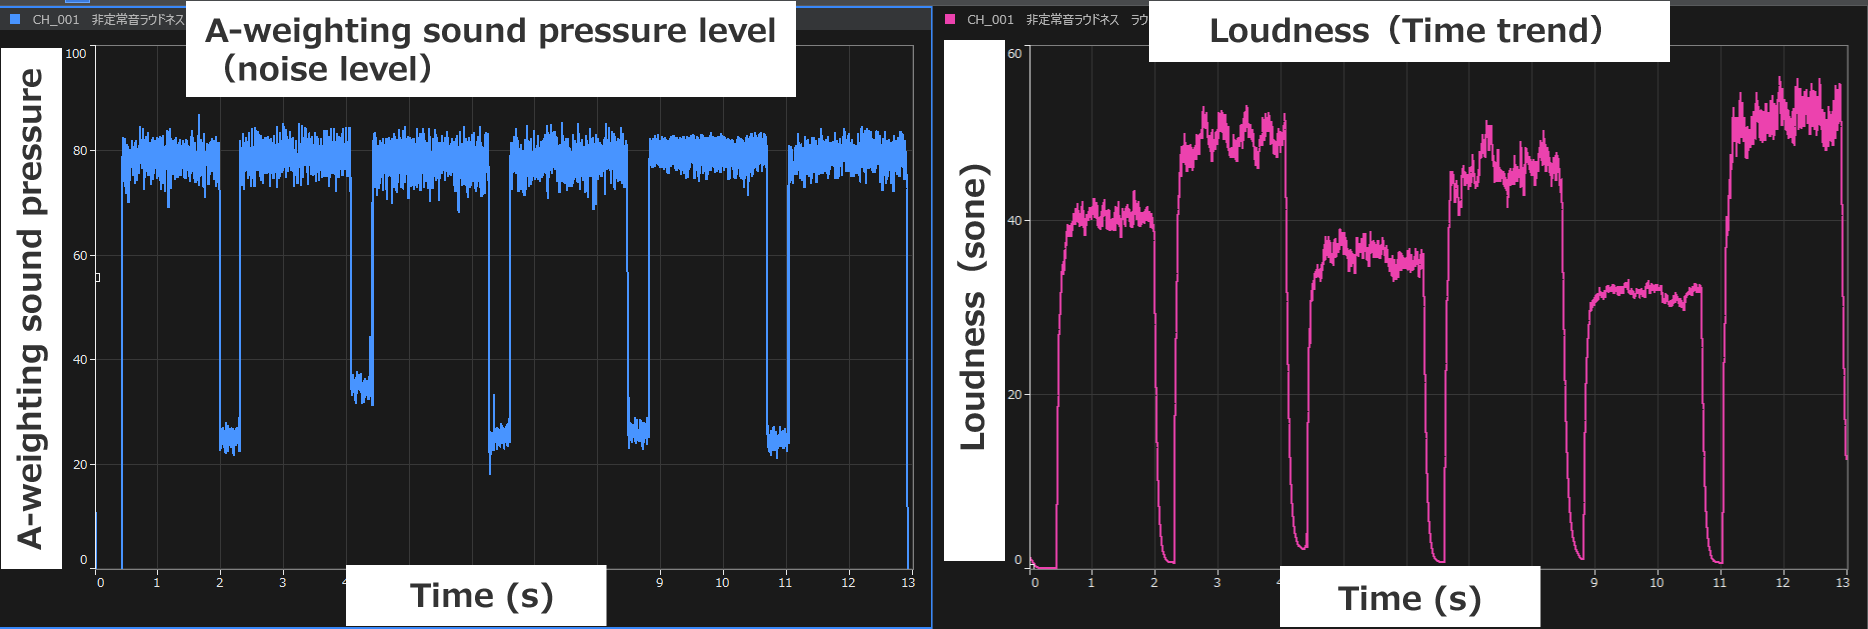
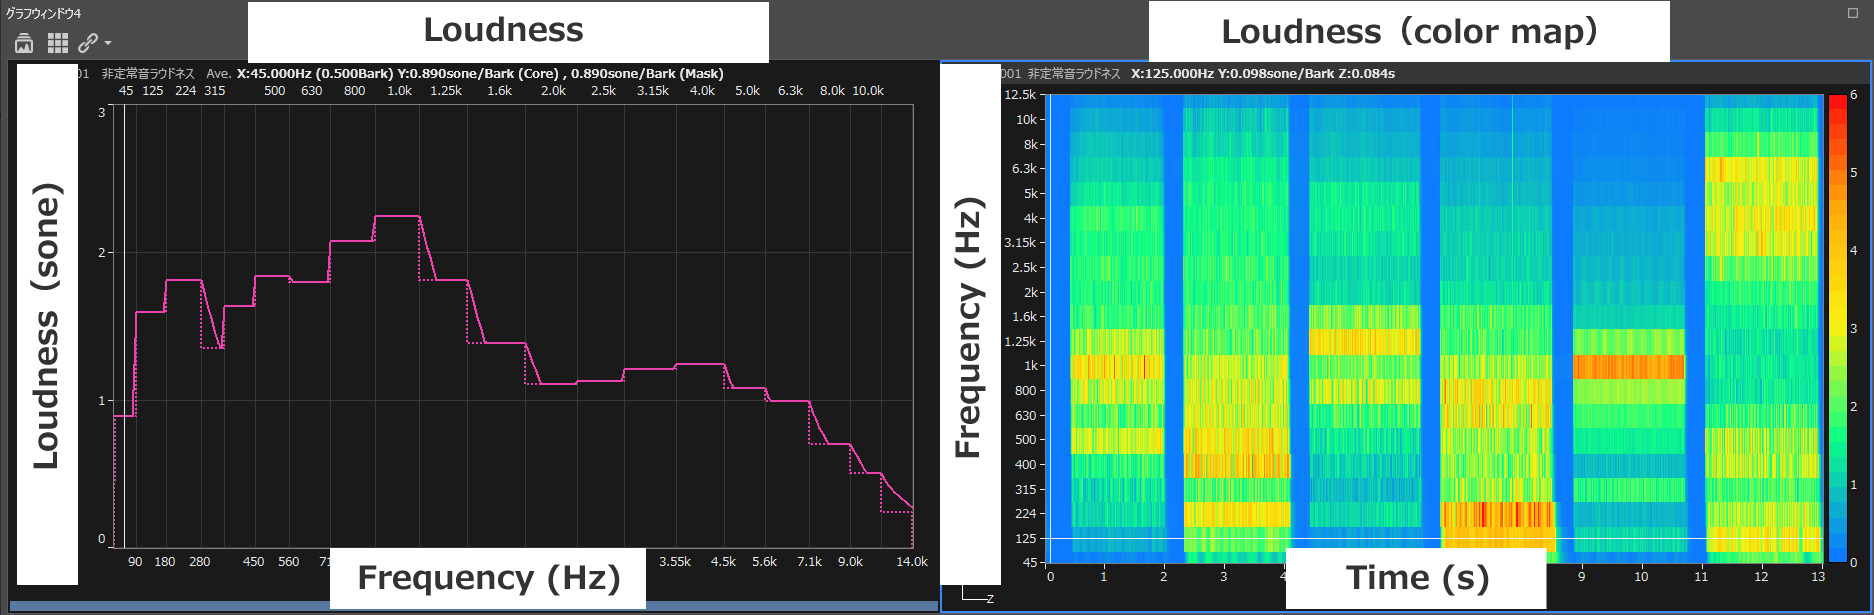
What is loudness?
Loudness (the magnitude of the sound) represents the sensory amount (total sum of excitement of the auditory nerve) that represents the intensity of the subjective feeling of the sound. The loudness of a pure tone of 1 kHz and 40 dB is defined as 1, and the loudness of other sounds is expressed as multiples of this. The unit is sone.
Case study1 Comparison of mechanical sounds
*Beware of sound volume.
The following graph shows the example of analysis to 6 mechanical sounds which has different loudness each.The graph on the left (blue) is an analysis result of the "A-weighting sound pressure level (noise level)", and shows same values for all 6 sounds. On the other hand, the graph on the right (red) is an analysis result of "Loudness", and shows all 6 sounds have different values.
When hearing these 6 sounds, we recognize that each sound has different sound loudness, just like the result of Loudness.
By using Loudness, it is possible to evaluate the differences of sound loudness, which cannot be found by evalution based on the sound pressure such as the A-weighting sound pressure level.
| Model | Product name | Qty |
|---|---|---|
| OS-5100 | platform | 1 |
| OS-0525 | Sound quality evaluation function | 1 |
|
* Sound recording equipment |
||
Case Study 2 Identifying noise
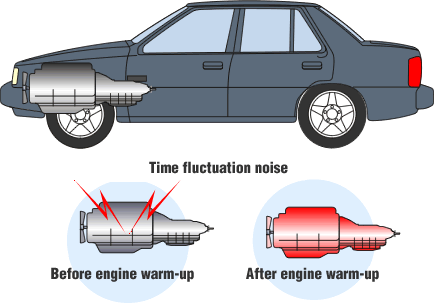
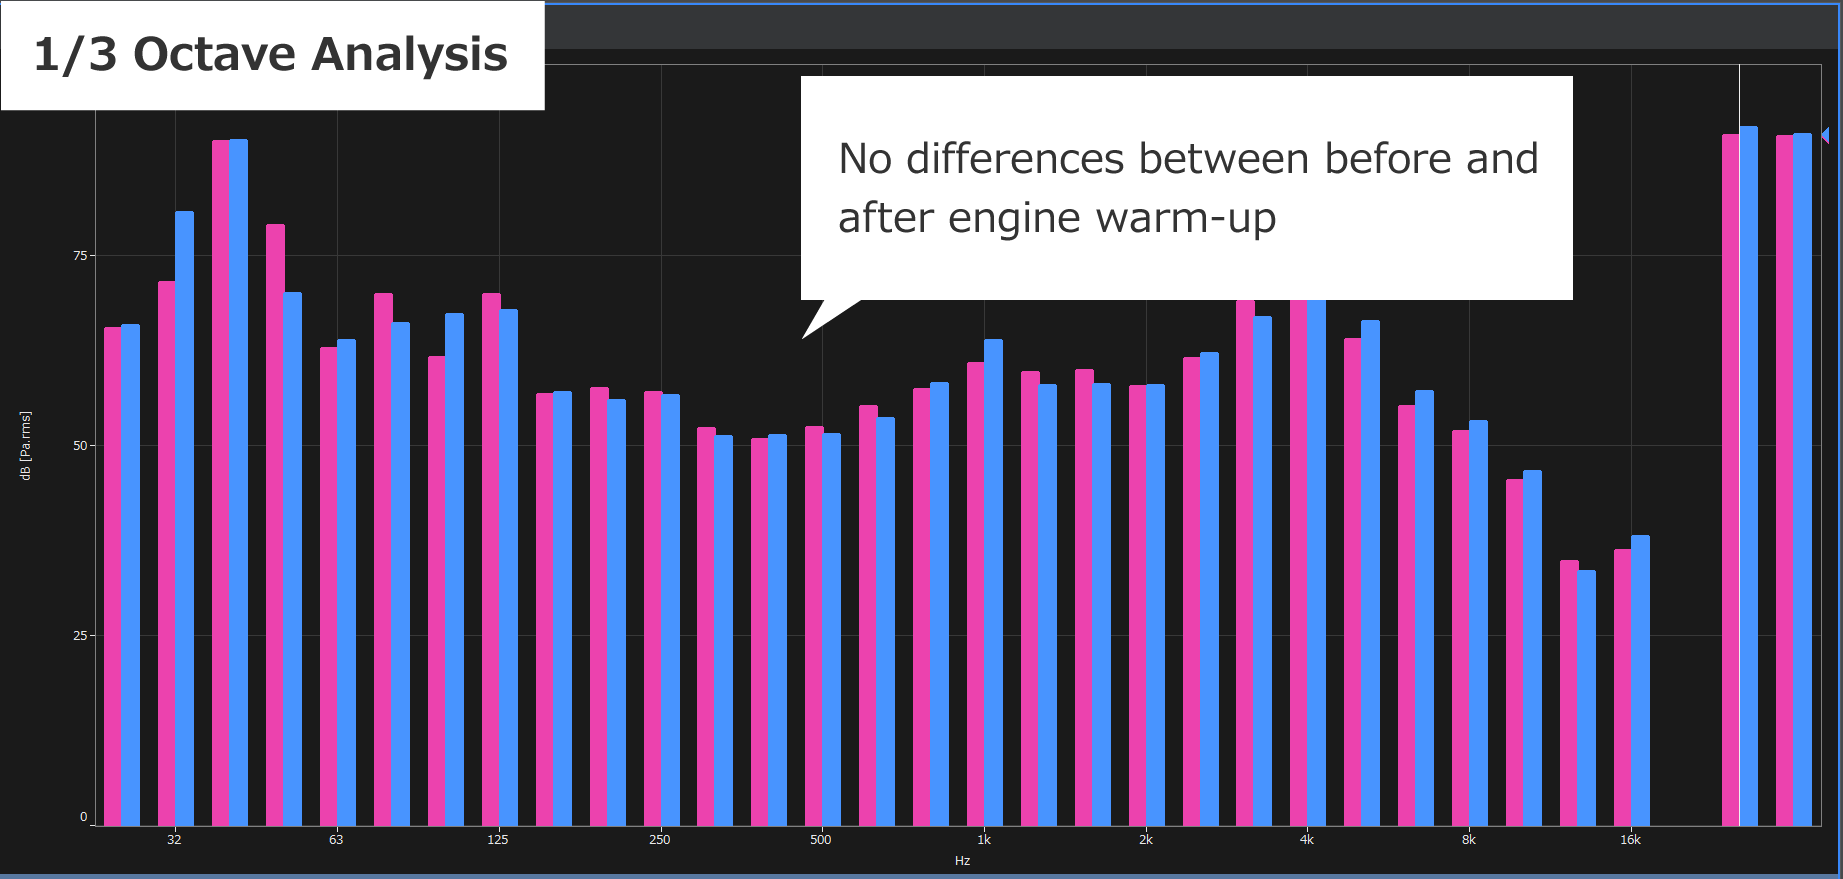
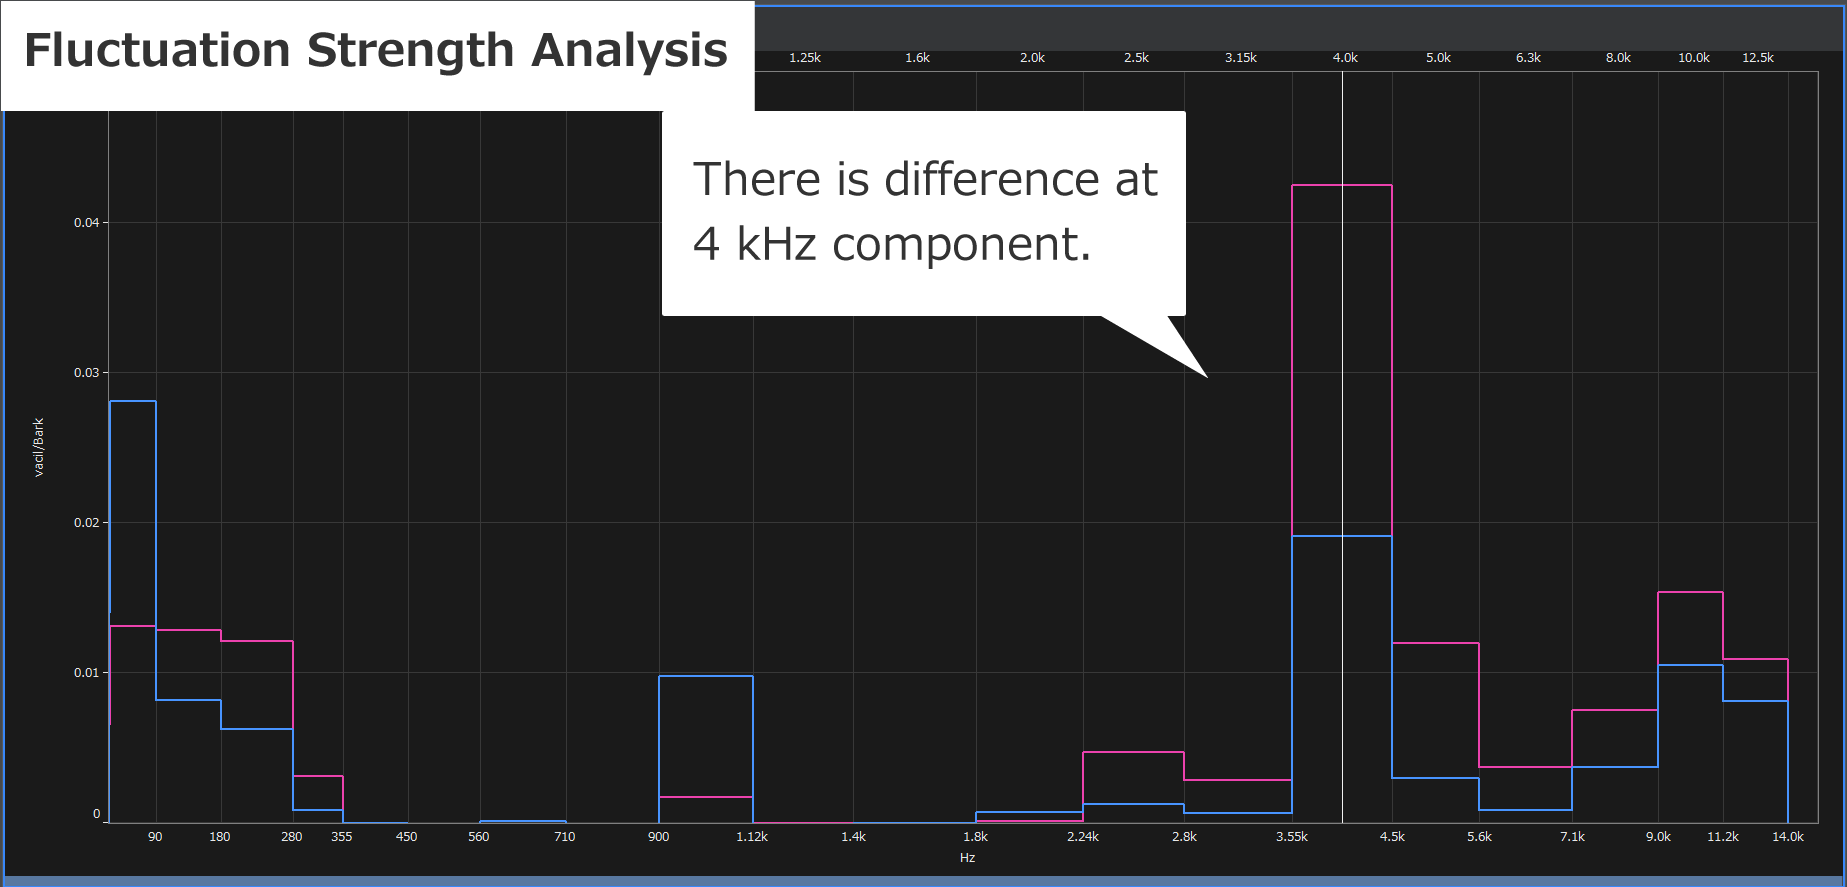
When time fluctuation noise is inaudible hidden in engine sound after an engine warm-up even though it had been heard before engine warm-up, the fluctuation strength analysis focused on time fluctuation component is effective to make the noise features clear, which cannot be figured out by the octave analysis. The results of fluctuation strength analysis reflect on the changes of engine sound before/after warm-up. 。
| Model | Product name | Qty |
|---|---|---|
| OS-5100 | Platform | 1 |
| OS-0524 | Octave Analysis function | 1 |
| OS-0525 | Sound quality evaluation function | 1 |
*Sound recording equipment |
||

*Beware of sound volume.

*Beware of sound volume.
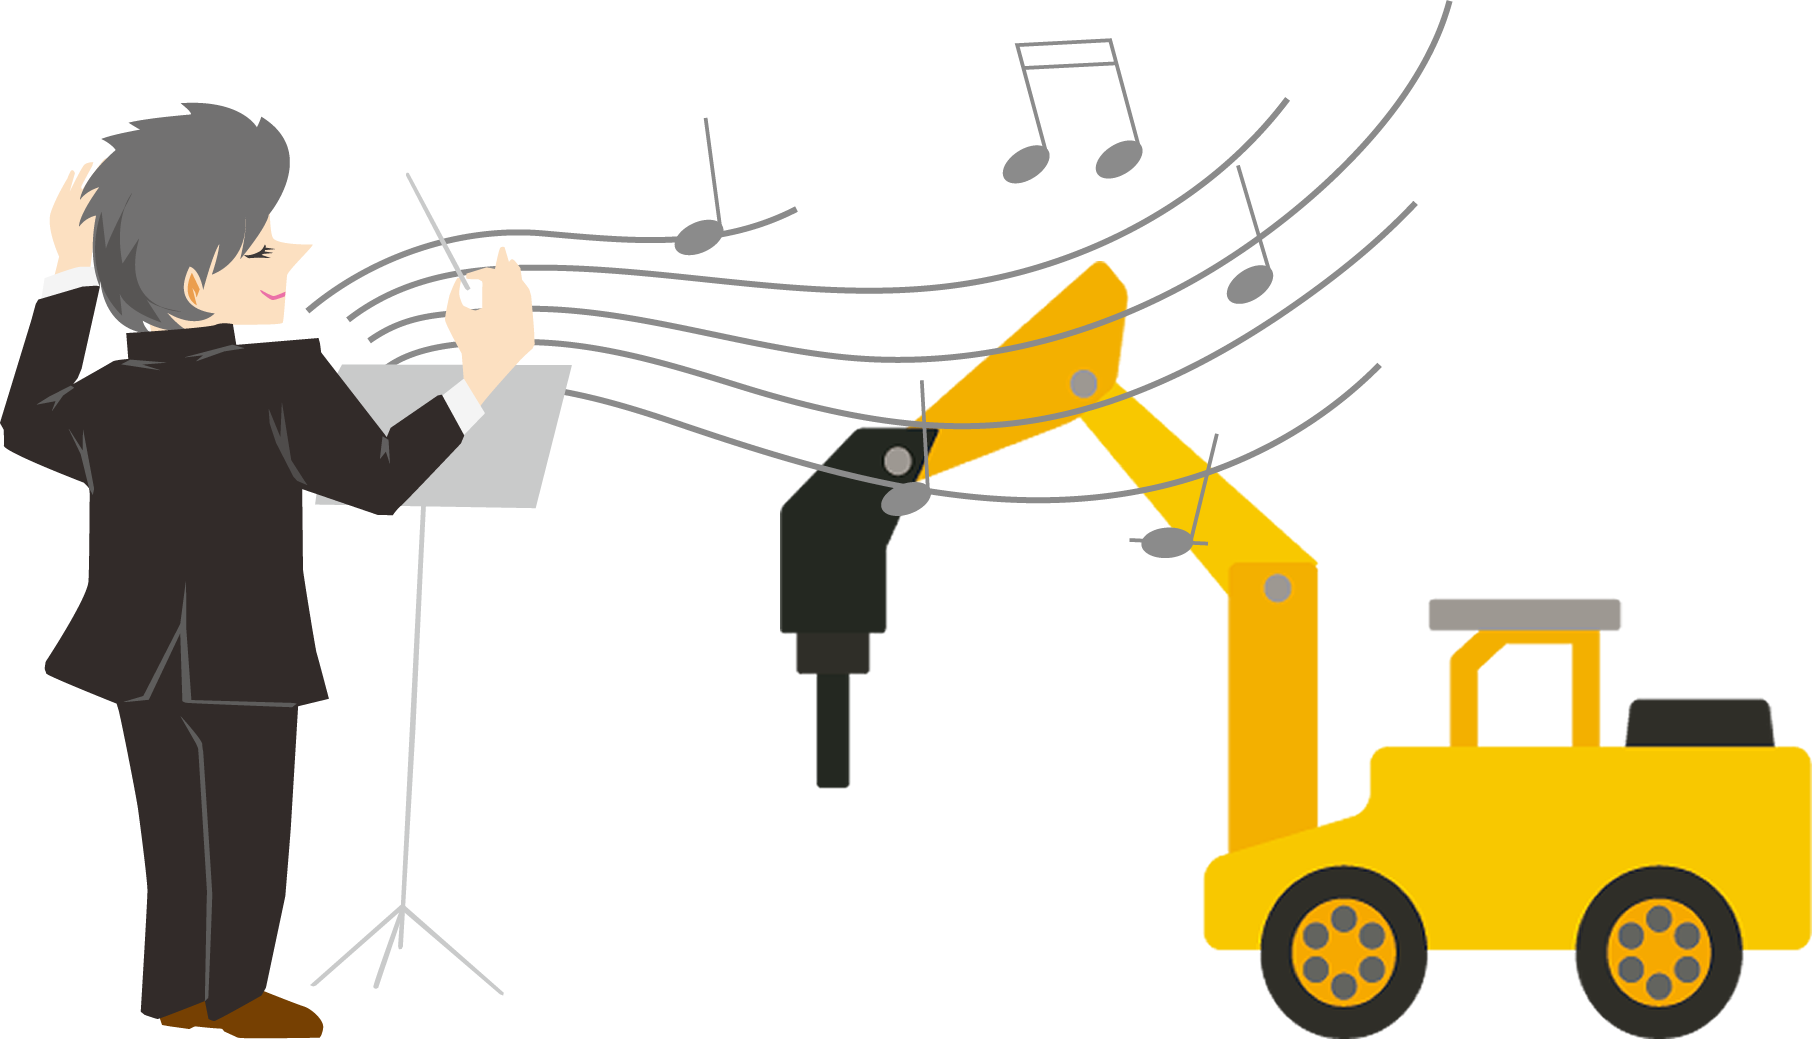
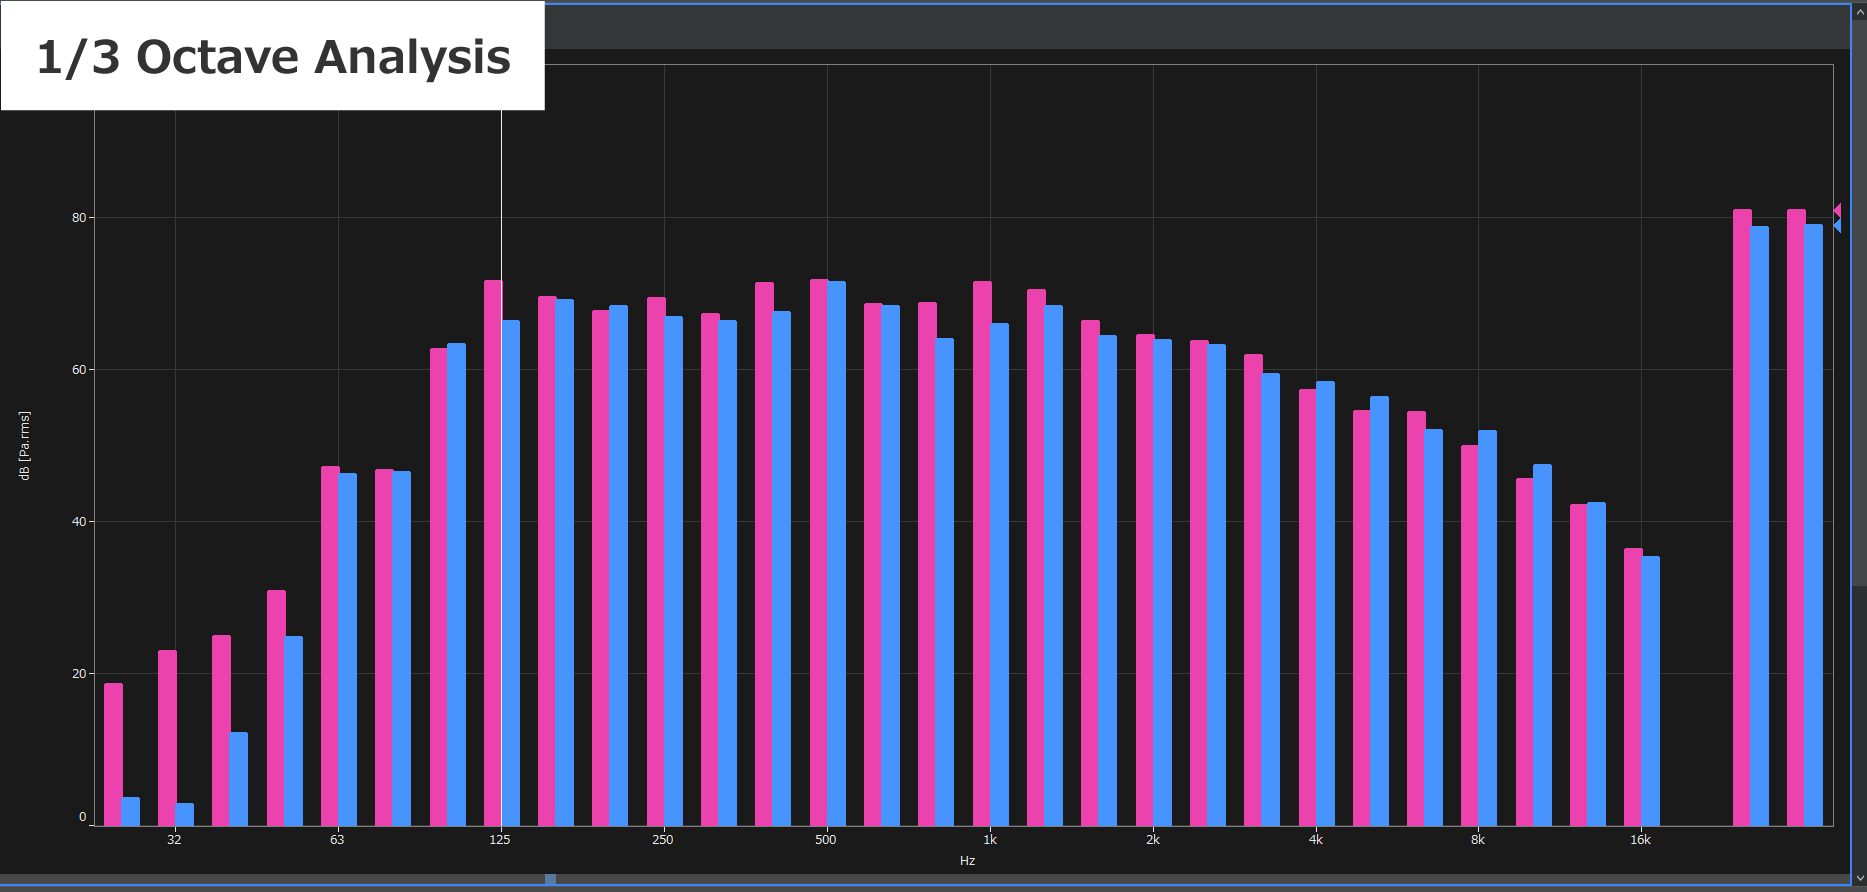
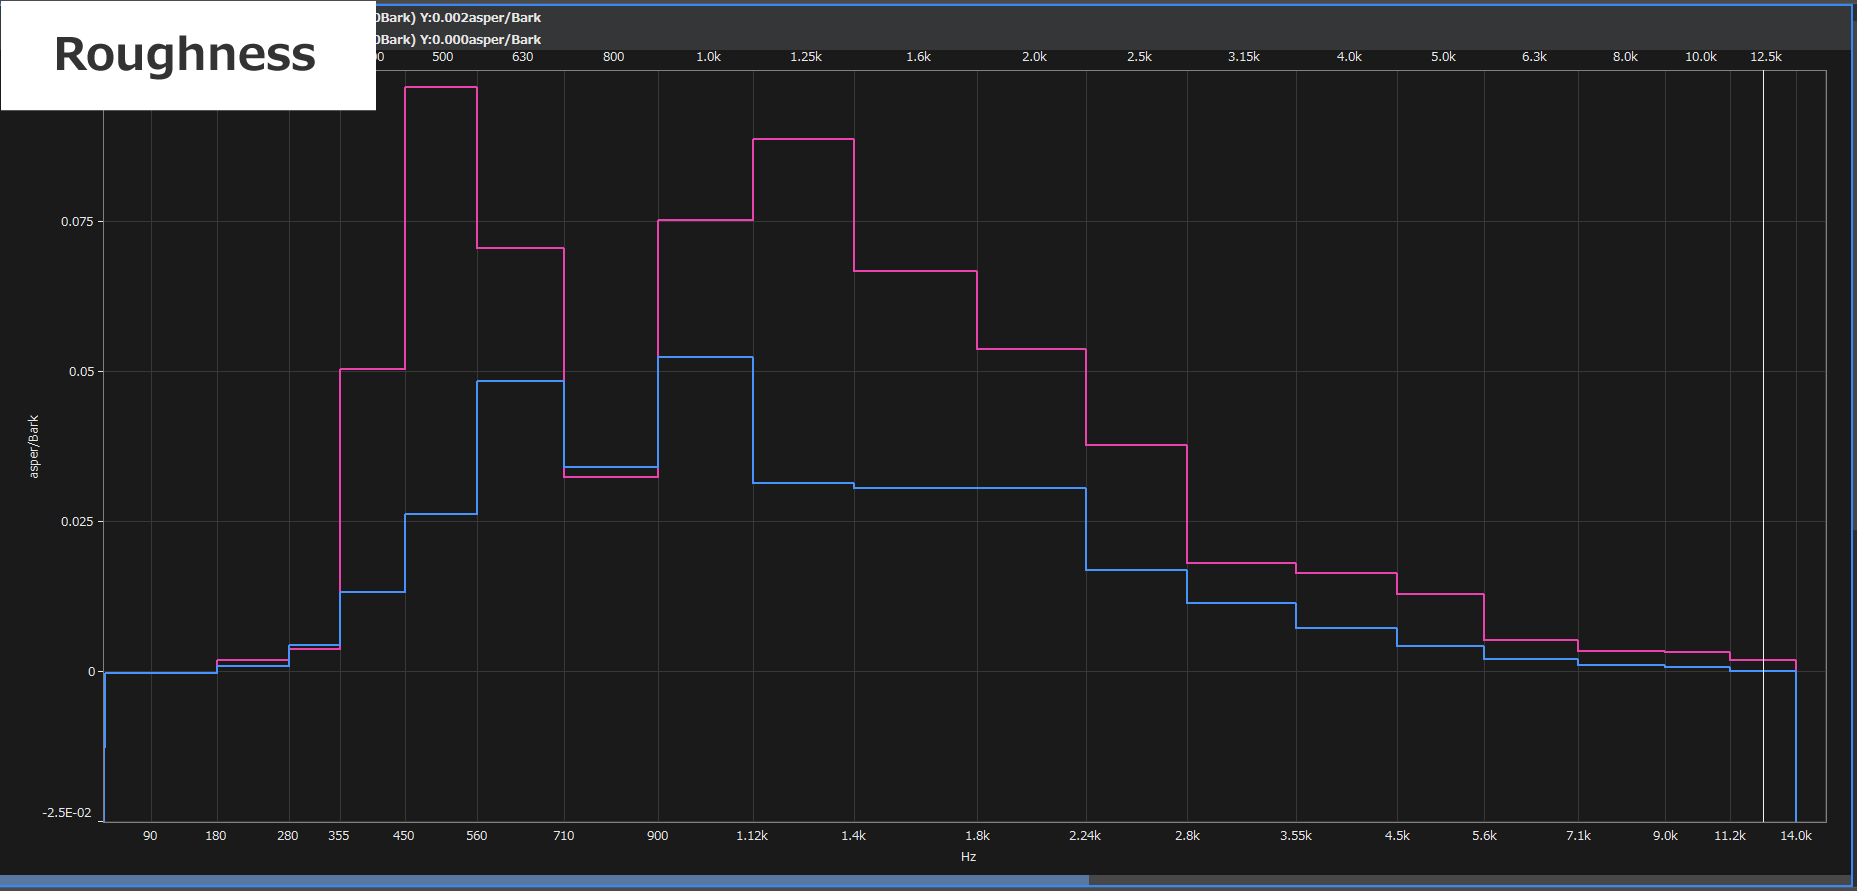
Case Study 3 Comparison of excavator sound and symphony sound
The following analysis example shows the comparison of excavator sound and symphony (The 4th movement of the 5th Symphony composed by Beethoven). Although these two sounds are completely different, after performing 1/3 octave analysis, both spectrums are almost the same result. Then, the parameter of sound roughness is used to compare and evaluate the two sounds. The graph below shows the spectrum of roughness. The higher the value is, the larger the roughness is. The sound difference between symphony and excavator is clearly found by using this parameter.
| Model | Product name | Qty |
|---|---|---|
| OS-5100 | Platform | 1 |
| OS-0524 | Octave analysis function | 1 |
| OS-0525 | Sound quality evaluation function | 1 |
*Sound recording equipment |
||

*Beware of sound volume.

*Beware of sound volume.
Case Study 4 Evaluation of sounds generated from motor
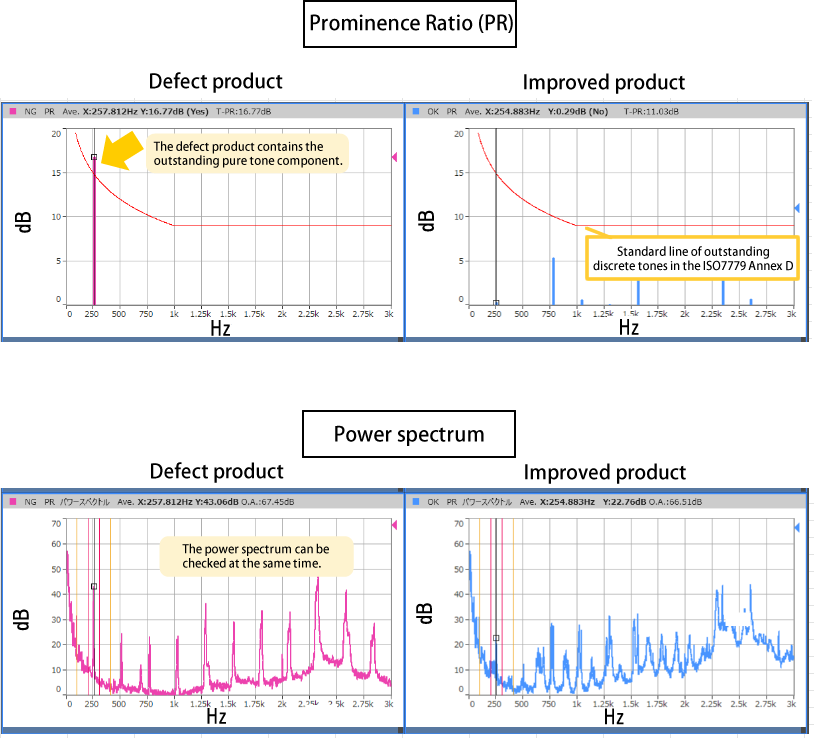
The sound generated by motors and inverters contains pure tone components, and even if the amplitude is small, they tend to be unpleasant. There are parameters such as tonality, TNR (Tone-to-Noise Ratio), PR (Prominence Ratio), etc. to quantify whether or not those unpleasant sounds have been improved.
The following is an example of the results of analyzing tonality and PR. Compare the tonality and PR of the defect product and the improved product with the motor driving sounds. Even though the sound pressure level is the same, the tonality and Total-PR (total sum of PR) of the defect product are high. As shown in the PR graph, you can check the PR and frequency for the outstanding pure tone component of the defective product. You can also check if the PR value exceeds the outstanding discrete tones in the ISO7779 Annex D.
| Model | Product name | Qty |
|---|---|---|
| OS-5100 | Platform | 1 |
| OS-0525 | Sound quality evaluation function | 1 |
*Sound recording equipment |
||
Defect product
Improved product
*Beware of sound volume.