Fluctuation Sound Analysis Function OS-0526
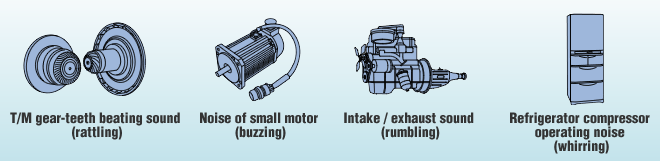
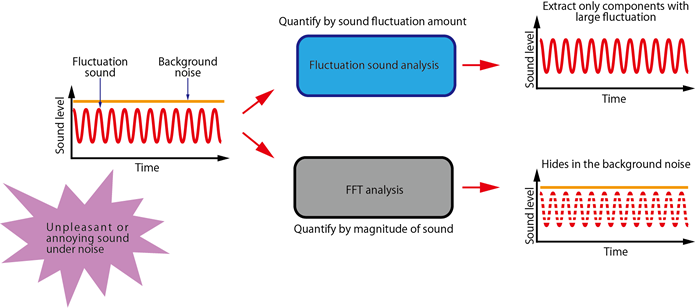
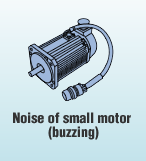
Although the magnitude of the sound is not so large, there are many “unpleasant sound” in the world. For example, “rattling” and “humming“ sounds generated from interior items while driving a car, or abnormal sounds such as “buzzing“ sounds that can be heard in the rotation sound of a small motor, etc. Sounds with significant temporal fluctuation often feel unpleasant even the magnitude of sound (level) is not so large. The fluctuation sound analysis is the analysis that can extract only the components with large time fluctuation that are not affected by the level. As a result, it becomes possible to quantify the characteristics of various temporal fluctuations that were difficult to detect with conventional FFT, basic roughness or fluctuation strength. In addition, since it can be evaluated with two axes of sound tone (high and low) and time fluctuation cycle for various sound designs (applying effect), deeper analysis than conventional technology is possible.
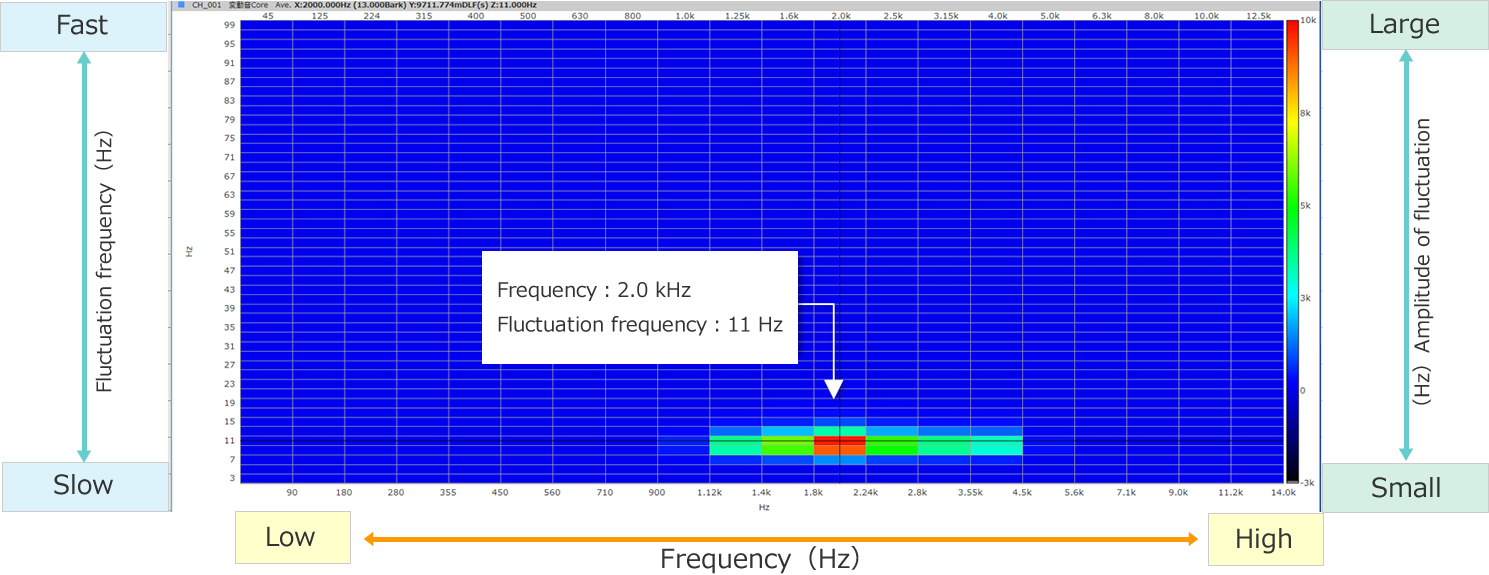
Example of Fluctuation Sound Analysis 1
High-pitched, slowly fluctuating sound
*Beware of sound volume.
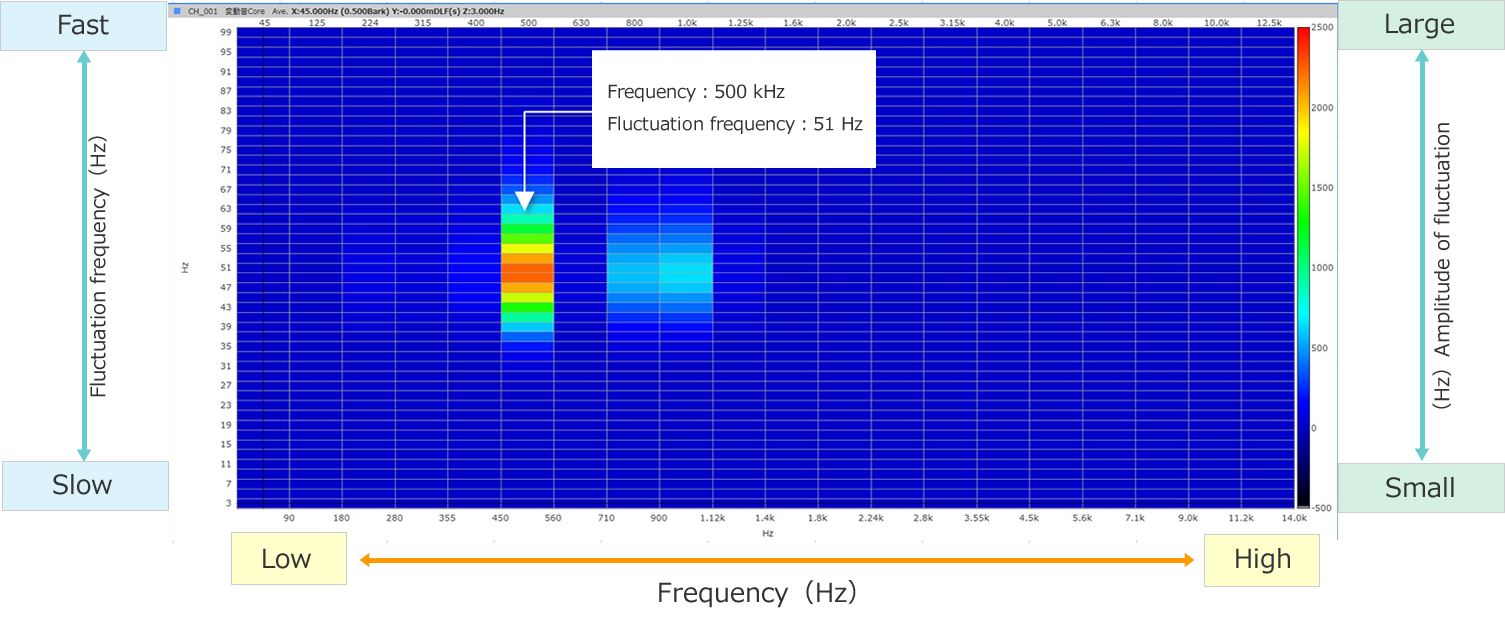
Example of Fluctuation Sound Analysis 2
Low-pitched, fast fluctuating sound
*Beware of sound volume.
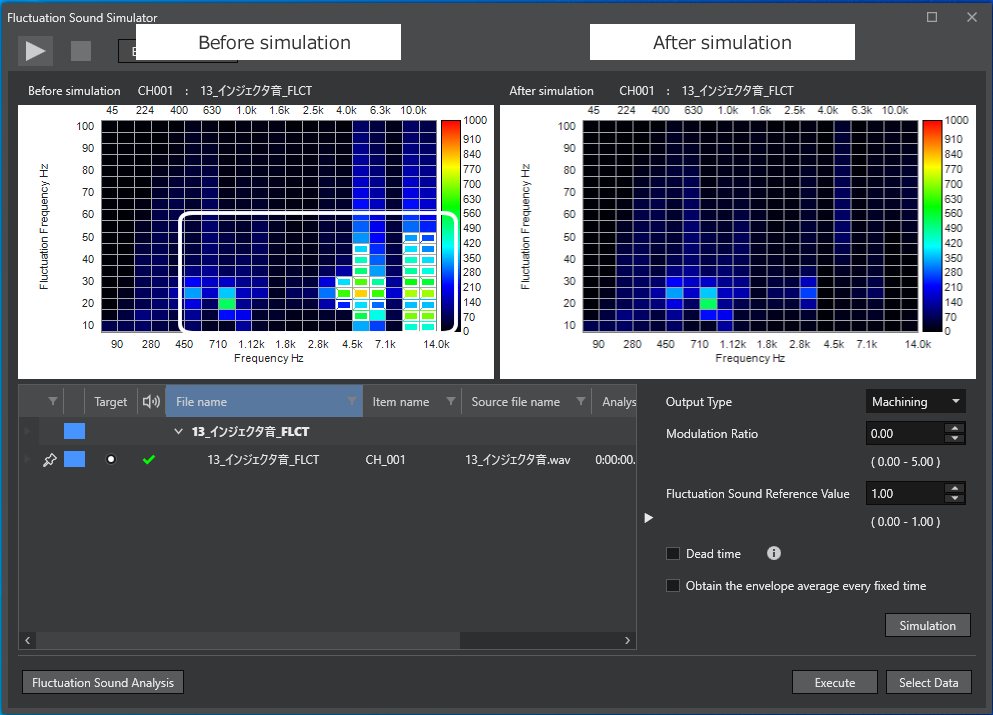
Fluctuation sound simulator
Before simulation
*Beware of sound volume.
After simulation
*Beware of sound volume.
With the fluctuation sound simulator, the analysis result can be evaluated while adjusting the fluctuation components. You can eliminate only annoying fluctuation components and amplify only easy-to hear ones. Unlike standard bandpass filters which raise or lower the sound pressure level of the given band overall, this filter raises or lowers only fluctuation components without changing sound pressure levels. This simulator can eliminate only the annoying fluctuation sound component while keeping the frequency characteristics as it is.
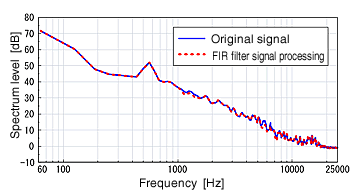
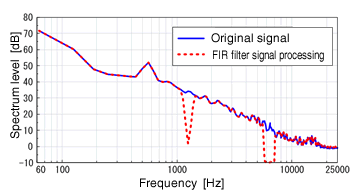
Here is a comparison of frequency characteristics when the fluctuating components are eliminated by the fluctuation sound simulator and the band reject filter. In both methods, the rattling sound disappears. When using the fluctuation sound simulator, the frequency characteristics did not change from the original one. While, when using the band reject filter, the frequency characteristics quite changed as the components of the corresponding band were attenuated
Case study 1 Abnormal sound from a small motor
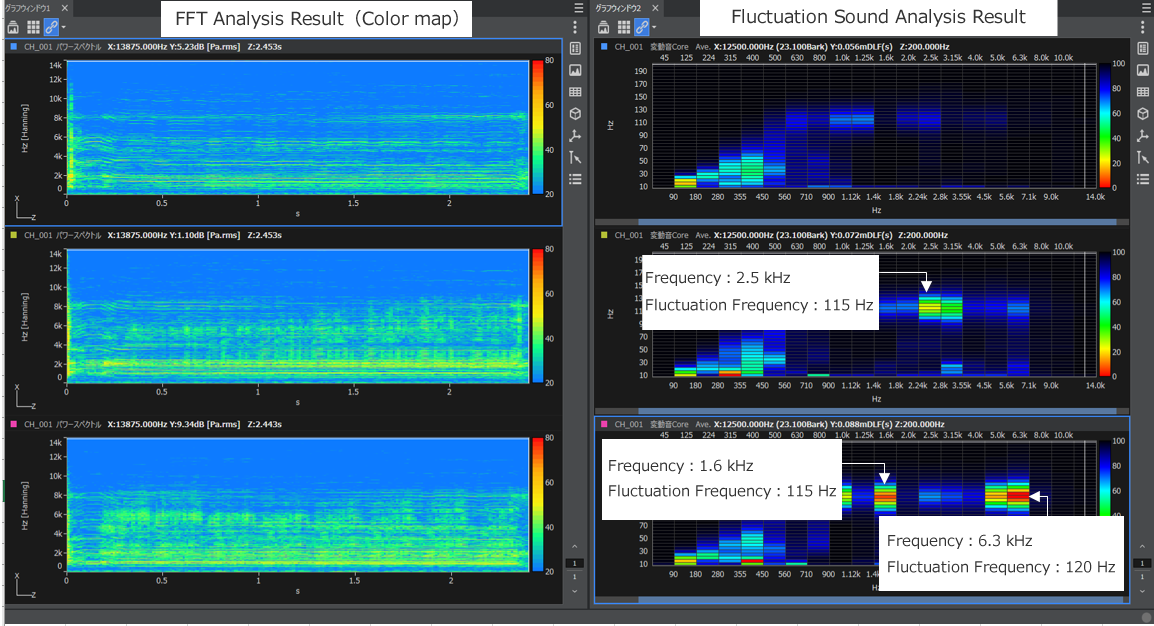
A person listened to the operating noise of a small motor and made a pass/fail judgment. Frequency analysis was performed by normal FFT analysis, but it could not be judged well. On the other hand, when the fluctuating sound analysis focusing on the fluctuating sound was performed, the difference between the good product and the defective product could be clarified.
| Model | Product | Qty |
|---|---|---|
| OS-5100 | Platform | 1 |
| OS-0522 | FFT Analysis function | 1 |
| OS-0526 | Fluctuation sound analysis function | 1 |
|
Sound recording equipment |
||
Clear sound
(no abnormality)
Defective product 1
Abnormal noise with a little unclear sound
Defective product 2
Abnormal noise
with unclear sound
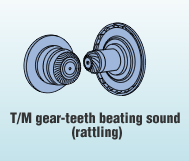
Case study 2 T/M gear teeth beating sound (rattling noise)
*Beware of sound volume.
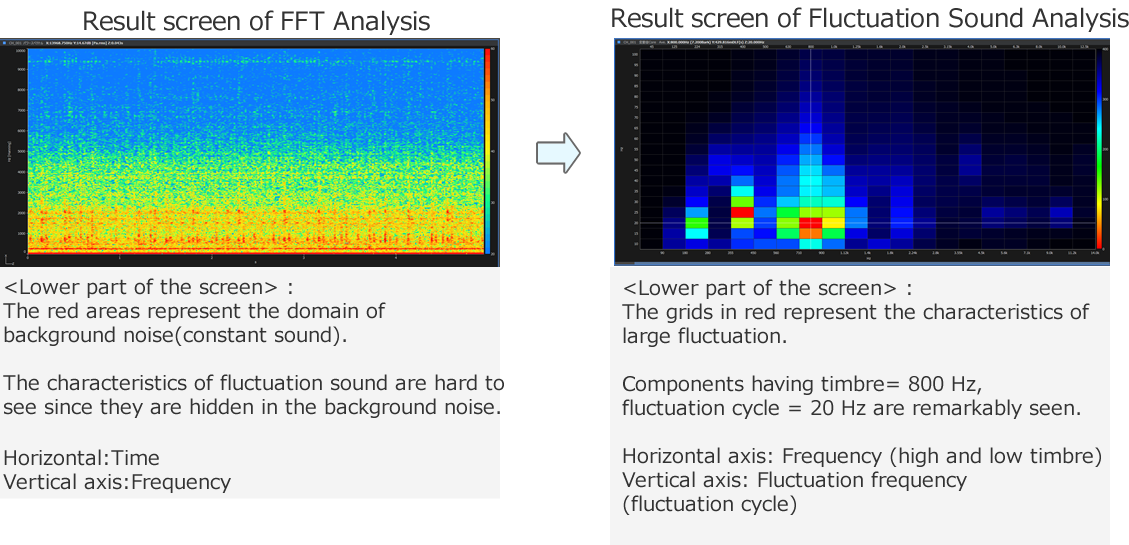
Since the gear rattling noise having frequency components in the 800 Hz frequency band is hidden in the background noise, any characteristics cannot be found by FFT analysis (Figure1). The squares where the horizontal axis representing the timbre and the vertical axis representing variable period intersect at 800 Hz and 20 Hz, are displayed in a strong color as characteristics of the rattling noise (Figure2). Fluctuation sound analysis enables evaluation of various temporal fluctuation characteristics that can hardly be detected by the amount of the sound level.
| Model | Product | Qty |
|---|---|---|
| OS-5100 | Platform | 1 |
| OS-0522 | FFT Analysis function | 1 |
| OS-0526 | Fluctuation sound analysis function | 1 |
|
*Sound recording equipment (High performance Sound Level Meter, FFT analyzer, etc.) is required |
||