![]()
![]()
![]()
Major function of OS-2000 series ver.2.11
Category |
Item |
software | Package | Model | |
|---|---|---|---|---|---|
| Basic function |
Data manager | ||||
| Window manager | |||||
| Improved operation of waveform color selection | |||||
| Search cursor function | OS-2500/2600/2700 | ||||
| File Marker | OS-2500/2600/2700 | ||||
| Sound playback function | OS-2500/2600/2700 | ||||
| Search function | OS-2500/2600/2700 | ||||
| Control API | OS-2710/2720/2740/2760 | OS-2700 | |||
| Analysis manager | OS-2500/2600/2700 | ||||
| Supports Windows 10 | OS-2500/2600/2700 | ||||
| Time waveform overlay function | OS-2500/2600/2700 |
||||
| Channel search function | OS-2500/2600/2700 |
||||
| Import | Supports ERG file made by simulation software of IPG Automotive GmbH | OS-2500/2600/2700 | |||
| Supports data file by data loggers of other companies | OS-2500/2600/2700 | ||||
| Import of Excel file | OS-2500/2600/2700 | ||||
| Video importer | OS-0281 | OS-2500/2600/2700(OP) | |||
| TEAC AQ-VU importer | OS-0281 | OS-2500/2600/2700(OP) | |||
| FAMS importer | OS-2500/2600/2700 |
||||
| Supports DS-0328 file, MDF file and UFF file | OS-2500/2600/2700 | ||||
| Export | TDMS exporter | OS-2500/2600/2700 | |||
| AVI Exporter | OS-2500/2600/2700 | ||||
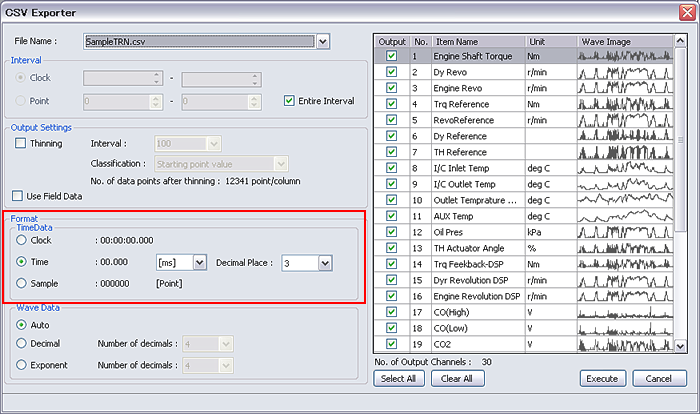
| CSV Exporter | OS-2500/2600/2700 | ||||
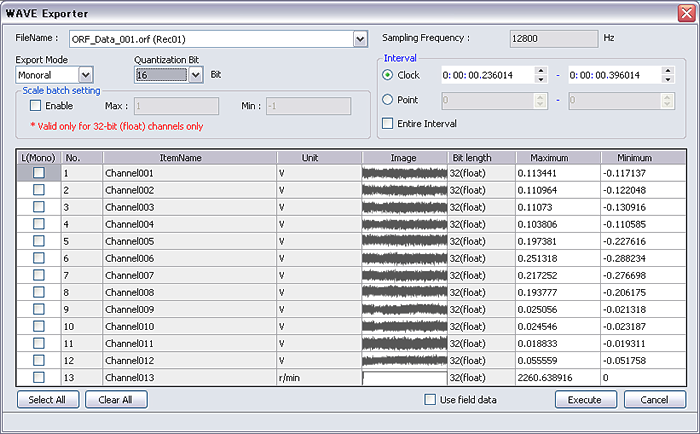
| WAVE Exporter | OS-2500/2600/2700 | ||||
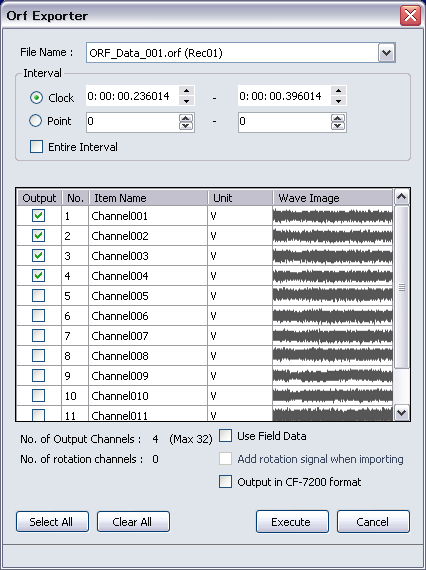
| ORF Exporter | OS-2500/2600/2700 | ||||
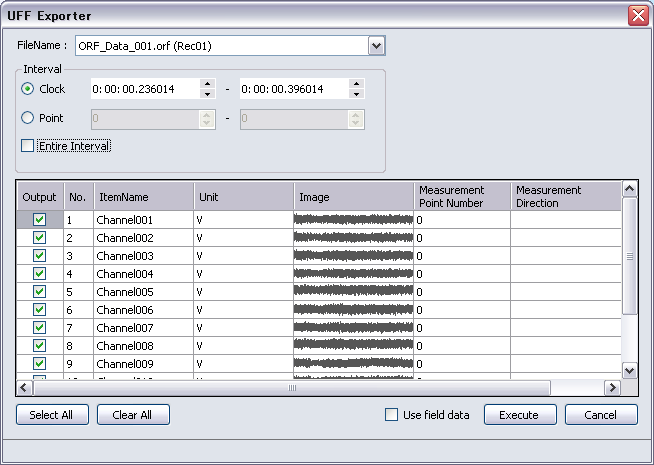
| UFF Exporter | OS-2500/2600/2700 | ||||
| MDF Exporter | OS-2500/2600/2700 | ||||
| Signal processing |
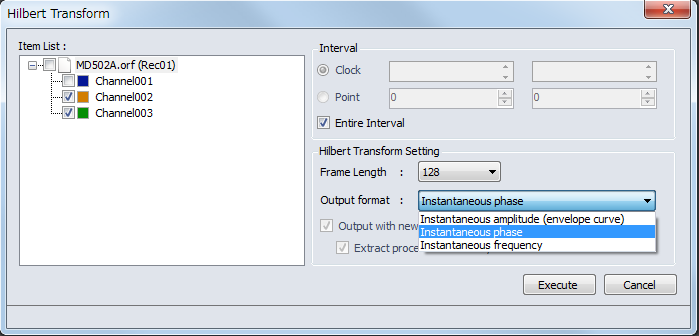
Hilbert Transform | OS-2700/2710/2720/2740/2760/2770 | OS-2700 | ||
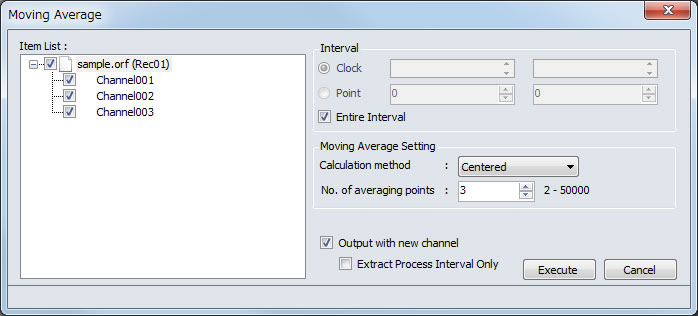
| Moving average | OS-2500/2600/2700 | ||||
| Event counter | OS-2500/2600/2700 | ||||
| Effective value calculation | OS-2500/2600/2700 | ||||
| Fluctuation simulator | OS-0273 | OS-2760 | OS-2500/2600/2700(OP) | ||
| IIR filter | OS-0261 | OS-2740/2760 | OS-2500/2600/2700(OP) | ||
| Synchronizer | OS-2500/2600/2700 | ||||
| DR-7100 Recording condition settings | OS-2500/2600/2700 | ||||
| Meter | OS-2500/2600/2700 | ||||
| Continuous automatic analysis | OS-0254 | OS-2500/2600/2700(OP) | |||
| Playback of video+Video monitor | OS-0281 | OS-2500/2600/2700(OP) | |||
| Non-time series graph | OS-0291 | OS-2500/2600/2700(OP) | |||
| Other function |
Signal calibration | OS-2500/2600/2700 | |||
| OSRECO | Recording/Playback function, supports DS-3000 series | OS-2500/2600/2700 | |||
| Supports ONO-LINK (USB) | OS-2500/26002700 | ||||
| Data transfer from DS-3000 series | OS-2500/2600/2700 | ||||
| Frequency analysis | OS-0251 | OS-2710/2740/2760 | OS-2500/2600/2700(OP) | ||
| Supports DS-3000 combustion analysis system | OS-0255 | OS-2770 | OS-2500/2600/2700(OP) | ||
| Waveform analysis |
Standard frequency analysis | Frequency range changing function | OS-0252 | OS-2720/2740/2760 | OS-2500/2600/2700(OP) |
| Extension of the max. analysis frame length | OS-0252 | OS-2500/2600/2700(OP) | |||
| Repeat trigger function | OS-0252 | OS-2500/2600/2700(OP) | |||
| Customization of frequency weighting | OS-0252 | OS-2500/2600/2700(OP) | |||
| Standard frequency analysis EX | OS-0252 | OS-2500/2600/2700(OP) | |||
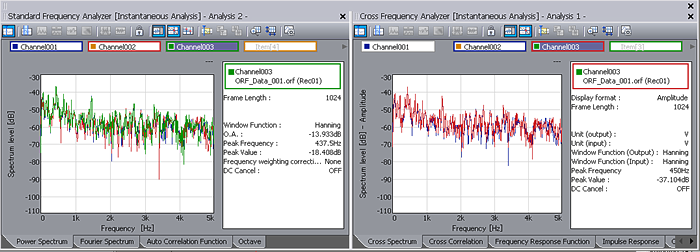
| Cross frequency analysis | OS-0252 | OS-2500/2600/2700(OP) | |||
| Cross frequency analysis EX | OS-0252 | OS-2500/2600/2700(OP) | |||
| Tracking analysis | OS-0265 | OS-2500/2600/2700(OP) | |||
| Time frequency analysis | OS-0263 | OS-2500/2600/2700(OP) | |||
| 1/N octave analysis | Overlaying of time trend graph | OS-0264/0272 | OS-2740/2760 | OS-2500/2600/2700(OP) | |
| G weighting correction | OS-0264 | OS-2500/2600/2700(OP) | |||
| Linear Leq | OS-0264 | OS-2500/2600/2700(OP) | |||
| Y-axis linear scale | OS-0264 | OS-2500/2600/2700(OP) | |||
| Sound quality evaluation | OS-0271 | OS-2740/2760 | OS-2500/2600/2700(OP) | ||
●Data manager
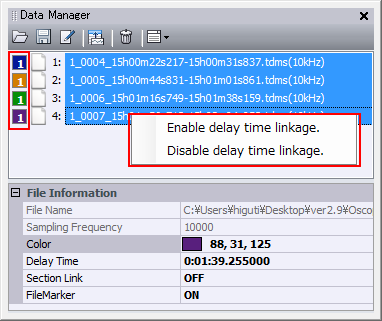
●Window manager
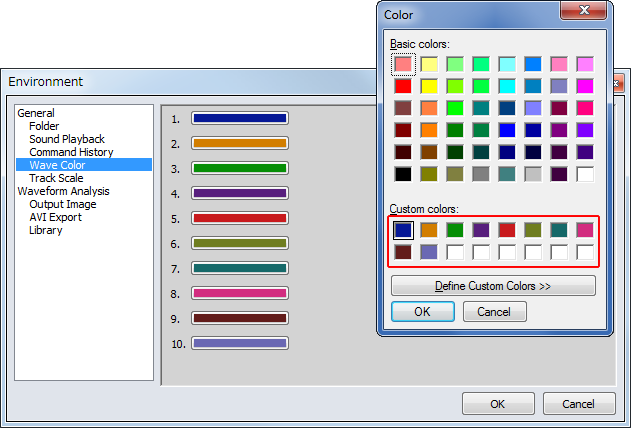
Even if you change the default color (Basic colors) of the waveform in the environment setting, the basic color list is displayed on the color setting screen and the waveform color can be restored to the original color.
This function controls starting or operating the OS-2000 series from the other software on Windows.
Control API is an application interface library to control access of OS-2000 series, and Control API monitor displays the display of its conditions.
Since Control API is Network responding, the OS-2000 series can be controlled from other PCs on a LAN without complicated setting.
As Control API is provided as DLL component, it allows for the use of managed code (Microsoft Visual C#) that is handled on NET Framework.
*The followings are required to be installed to a client PC. .NET Framework 2.0 Service Pack 2 or later / Microsoft Visual C# 2005 or later.
We provide sample program executable file and source code for controlling of the OS-2000 series. Sending commands from a client side allows it to control various functions externally.
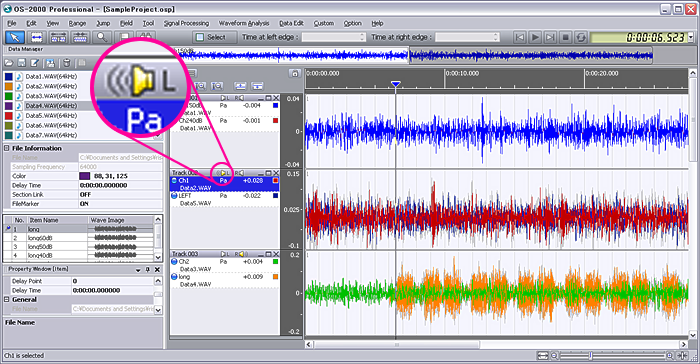
---Switching playback channel
Playback channel can be changed without stopping the sound in a seamless way.
You can change the channel whenever you want and compare subtle sound difference between channels.
---Mixing playback
This function enables mixing of several data on which a different phenomenon was recorded. For example, sound files of frequency-resolved sound can be compounded and played back as one file.
You can edit waveform with smooth operation by using of this function.
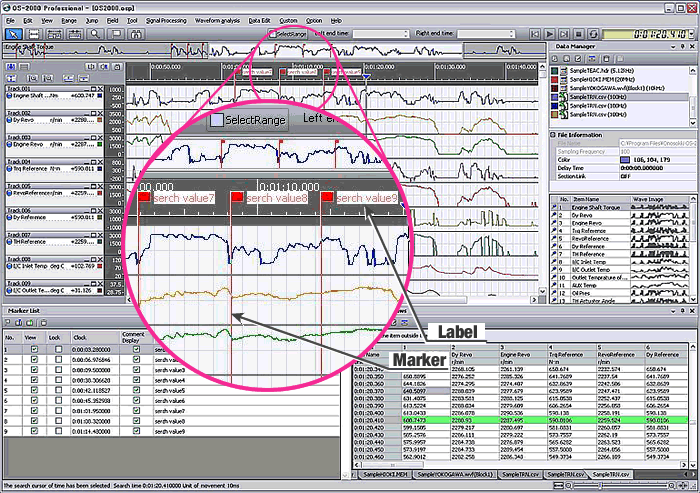
Marker and label can be placed automatically at the position of search result.
The OS-2000 series ver.2.8 supports Microsoft Windows 10 (32bit/64bit).
*Running as a 32-bit application in the 64-bit version.
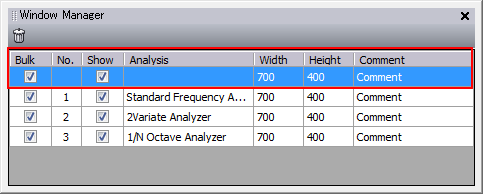
The Analysis Manager provides the capability to manage the analysis windows that are displayed in the OS-2000. It lets you do things like check the list of displayed analysis screens, change the size of analysis graph, show or hide analysis screens and add comments.
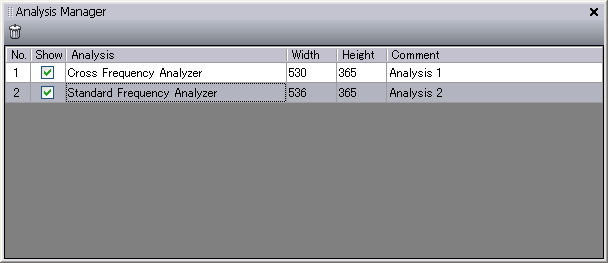
You can select graphs to show or hide in a list. Graphs can be adjusted the same in size.
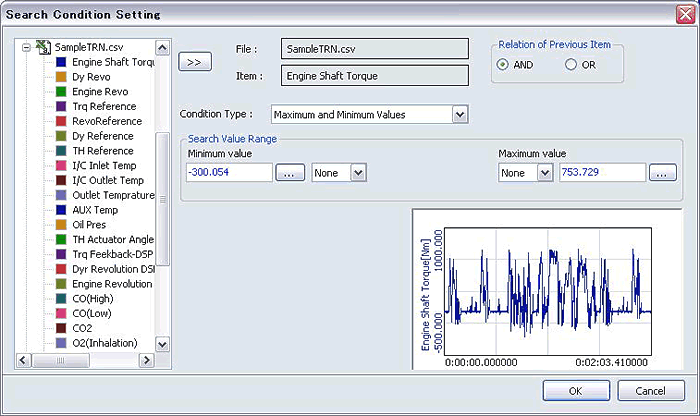
Searching and extraction of required data can be performed easily by versatile search criteria.
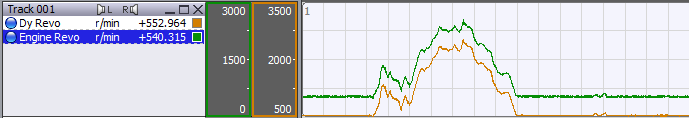
Time waveform overlay function
Up to 10 time-waveforms can be overlaid. The Y-axis scales of each overlaid waveform can be displayed simultaneously.
You can search channels (waveforms) by the items such as the name and unit even though you have imported a large number of waveforms. The waveforms that you need can be found easily among this large number of waveforms.
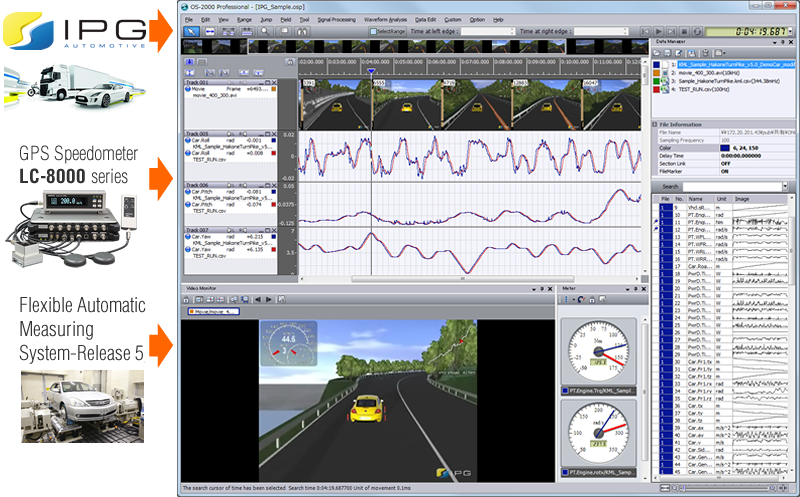
Supports the file made by IPG Automotive
The binary ERG file recorded by IPG Automotive simulation software (CarMaker/ TruckMaker/ MotorcycleMaker) is able to be read directly without conversion to the text file.
The actual vehicle data recorded by LC series GPS speedometer (Ono Sokki), test data recorded by FAMS-R5 Flexible Automatic Measuring System Release 5 (Ono Sokki), and simulation software data (IPG Automotive) are able to easily be compared on the OS-2000 series software by displaying side by side.
Supports data file by data loggers of other companies
| Manufacturer / Type | Models supported by OS-2000 series ver.2.11 |
|---|---|
IPG Automotive ERG file |
*.erg |
GRAPHTEC GBD file |
*.gbd |
TEAC Corporation TAFFmat file |
*.hdf |
TEAC Corporation AQ-VU file |
*.aqv |
Hioki E.E. Corporation |
*.mem |
MEIDEN |
*.meid |
Yokogawa Meters & Instruments Corporation |
*.wvf, *.wdf |
MDF File |
Measurement data format version 4.1., 4.0., 3.3. are supported. |
* .xls and *.xlsx formats of Excel® files can be imported. Microsoft Excel® 2003/2007/2010 must be installed on the same PC.
* Excel® is registered trademarks or trademarks of Microsoft Corporation of the U.S.A and other countries.
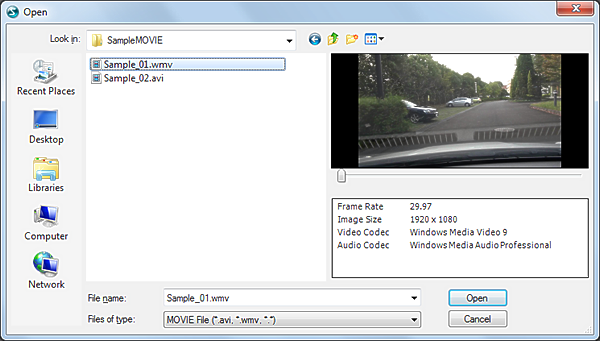
Video file (*.avi , *.wmv) can be read.
The file can be selected during watching the preview display.
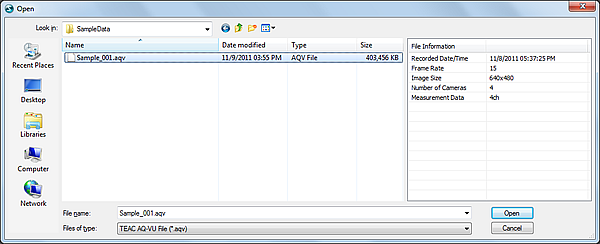
Recorded file (*.aqv) by Visual data recorder AQ-VU (made by TEAC) can be read. The AQ-VU is a data recorder which can record up to 4 channels video and analog signals at the same time.
Enables direct import of the recorded file by AQ-VU. Video and analog data can be checked without file conversion.
AQ-VU Visual data recorder(made by TEAC Corporation)
Synchronous 4channels video and data recording.
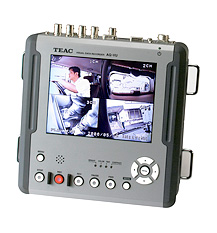 4 channels video and analog signals that can be recorded and played back at the same time. Unification of a visual and data measurement. Easy to verify the video and analog data using the built-in LDC monitor or a connected PC.
For example, the cause of a sudden vibration change during unattended or automatic vibration measurement can be checked visually by making the vibration data synchronization to the video data.
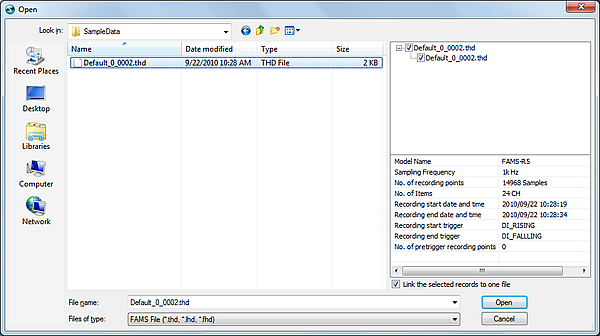
Importing data by FAMS-R5 (Flexible Automatic Measuring System Release-5) becomes possible. FAMS-R5 is helpful automatic measuring system for advanced and complicated tests including EV/HEV test. Large amount of data by FAMS-R5 can be extracted and visual ized by FAMS importer.
Supports DS-0328 file, MDF file and UFF file
DS-0328 file (*.tdms), MDF file (*.mf4), and UFF file (*.uff, *.unv, *.bunv) can be imported to the OS-2000 Series.
Recorded playback screen on the main window can be saved as video data.
Output format can be selected from three formats. You can now select "Time Eor "Sample Eas well as "Clock Eas time data.
The signal of each channel can be converted continuously to WAVE file (monaural). Signals of all the channels can be converted by one operation. This is a useful and efficient function for reproduction with media player or use with other software.
Advanced settings of output in WAVE format can be specified such as the maximum and minimum values, the number of bits.
ORF data with rotation information can be exported. After signal processing (digital filter, moving average), the ORF data can be used to perform tracking analysis by DS series. (only the ORF data with rotation information which is recorded by throughput software)
Time series data of the OS-2000 series can be exported to UFF file (Universal File).
The output format is code set 58.
It allows output in the ASAM MDF 4.0 file format, which is now widely used in the auto industry.
The upper limit of the average points was increased from 51 to 50000. The tendency of the waveform on a long term becomes easy to be found.
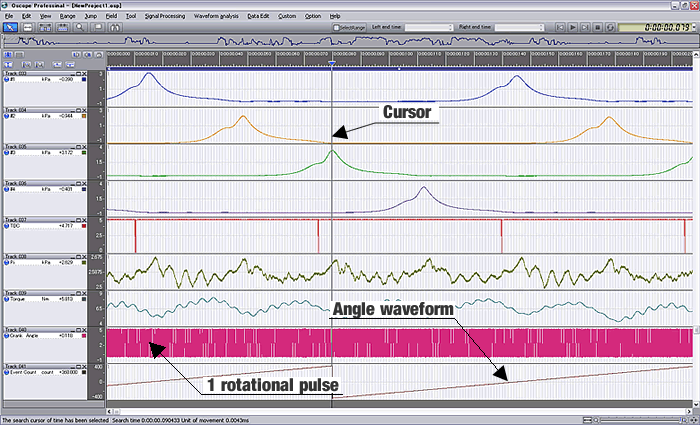
This function enables count waveform generation such as level, edge or variation waveform and is ideal for the use of changing rotational pulse signal into angle or distance waveform.
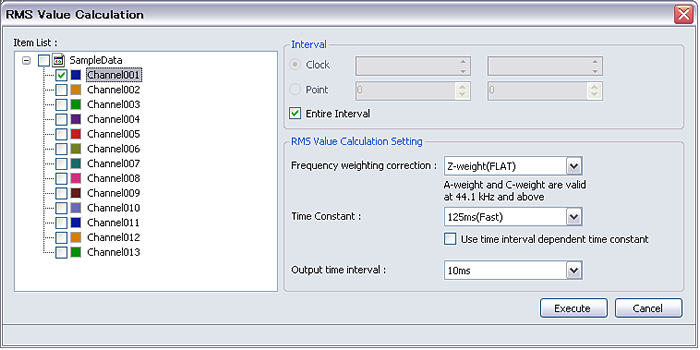
This function enables to obtain the effective value (RMS value) trend of a specified time-series waveform.
Frequency weighting correction, time constant, and output time interval can be specified.
The result of RMS can be output as a linear value.
Frequency weighting corrections can be selected from A-weighting, C-weighting, Z-weighting and G-weighting. (G-weighting is frequency correction characteristics for evaluating affect of micro low frequency (standardized in ISO7196:1995) to human senses.)
To check the effect of fluctuation sound, the frequency band component of the sound had to be increased and decreased by bandpass filter. So it cannot help changing the frequency characteristics of the sound.
The fluctuation sound simulator removes and amplifies only the fluctuation components of the sound without changing frequency characteristics.
You can extract the specified component when you want to check just the fluctuation component.
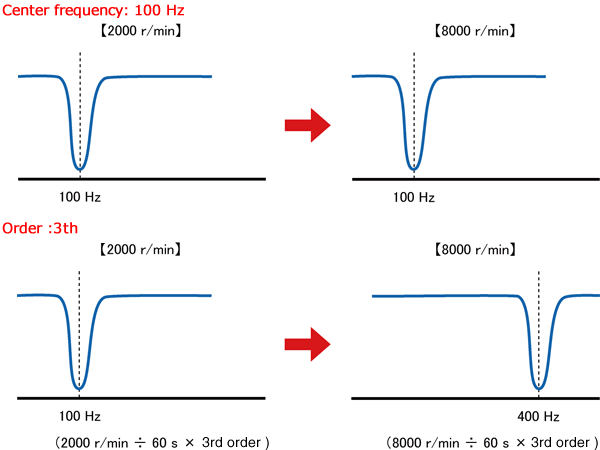
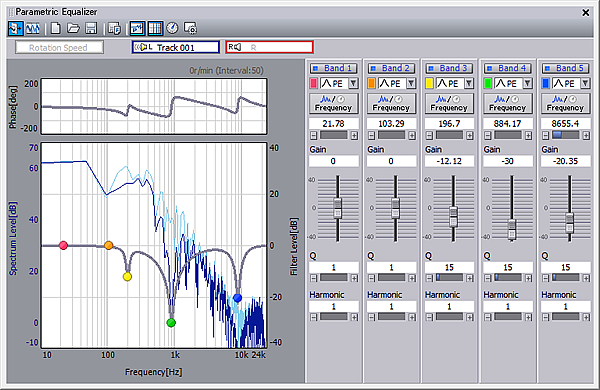
In Parametric Equalizer, not only frequency filter but also order filter is available. Order Filter is the filter for frequency of noise or vibration that changes according to the variation of rotation speed in rotation equipments including engine and compressor. Only noise and vibration that is generated from the specific rotating body can be extracted, removed, and evaluated.
The example of using BRF (Band reject filter) is as follows when the center frequency is 100 Hz and the order is third.
When the center frequency of the BPF is 100 Hz, the center frequency of the filter remains 100 Hz even if the rotation speed of the rotating body varies from 2000 r/min to 8000 r/min. On the other hand, the center frequency of the BRF changes depending on the rotation speed when the order is third; BRF for the center frequency100 Hz at 2000 r/min, BPF for the center frequency 400 Hz at 8000 r/min. Only the noise or vibration generated from the specific rotating body that has found in tracking analysis can be filtered.
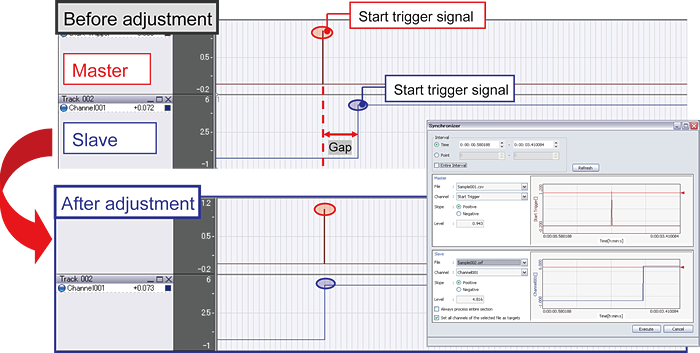
Synchronizer is a function for aligning the positions of waveforms. For example, when the recording start times of measurement data are misaligned, but start trigger signals were recorded for the respective channels, you can adjust the waveform to align the positions of the start trigger signals.
You can align the positions of plural time-series waveforms in terms of setting a threshold.
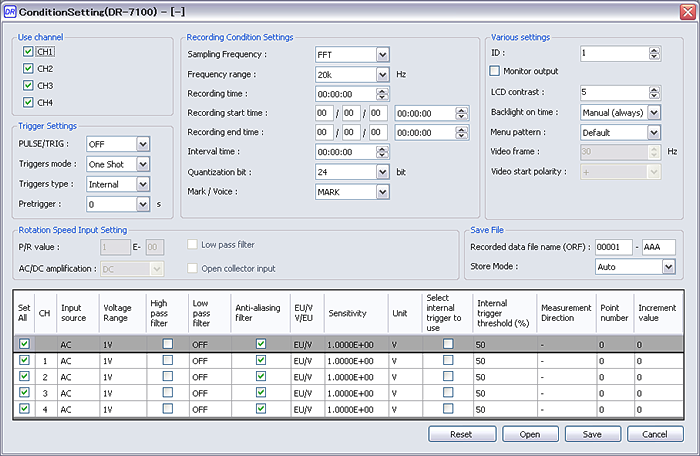
DR-7100 Recording condition settings
Specifies the condition settings for the DR-7100 (acoustic vibration portable data recorder).
A meter is a function for displaying the current value of an item in a meter.
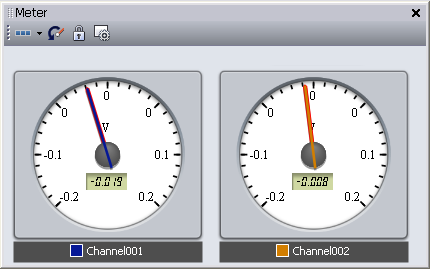
| Display | Analog and digital display (multiple displays available) |
|---|---|
| Function | Peak hold function, setting of warning range |
| Output | Analyzed data |
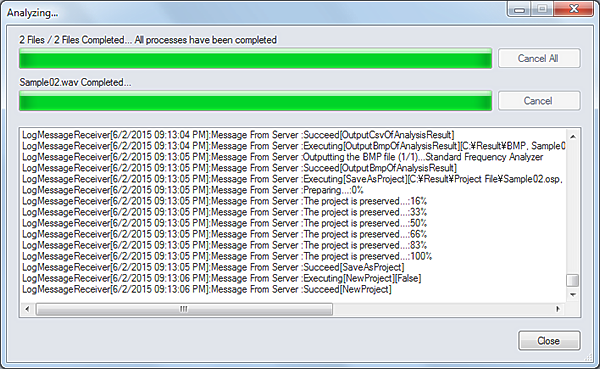
By using the template created in advance, FFT analysis (power spectrum) and 1/N octave analysis can be executed automatically up to 100 files.
*The OS-0252 FFT analysis and OS-0264 1/N octave analysis (options) are required to use continuous automatic analysis function.
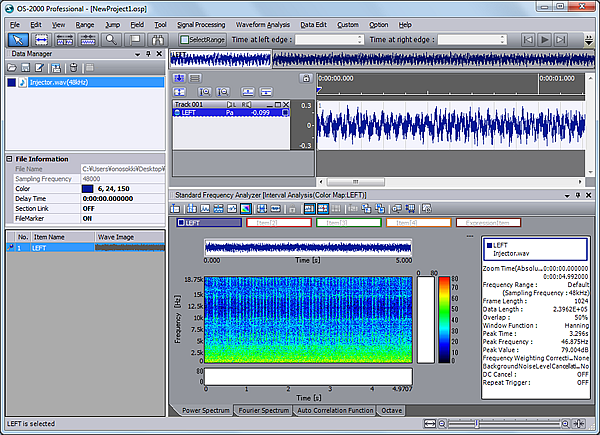
Example of continuous automatic analysis using DR-7100 (acoustic vibration portable data recorder)
![]()
![]()
![]()
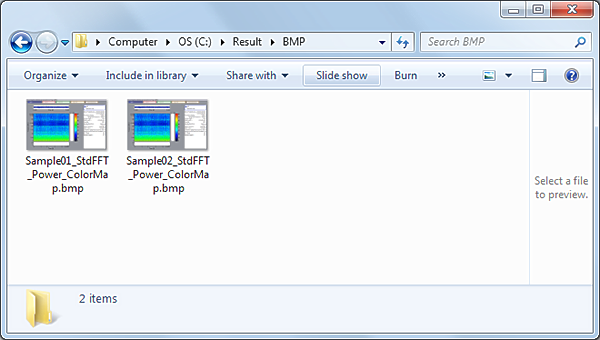
As above examples, analysis result output and those comparisons of multiple files can be easily operated by analyzing multiple files at once.
Helpful functions to make analysis using movie effective.
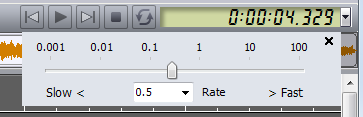
--Playback speed adjustment
Enables to adjust playback speed freely with a slider. The high speed video can be seen in slow motion. Also you can see the change of the continuous data in each step by using single frame step function.
--Brightness · contrast adjustment
Video not bright enough can be seen easily by brightness · contrast adjustment function.
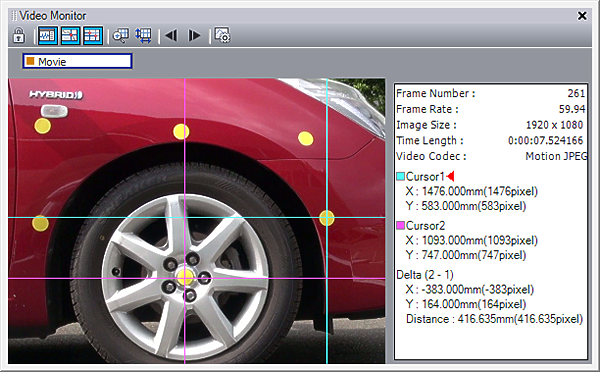
--Distance between two points display
Distance and displacement in the image can be checked by moving two search cursors with mouse operation.
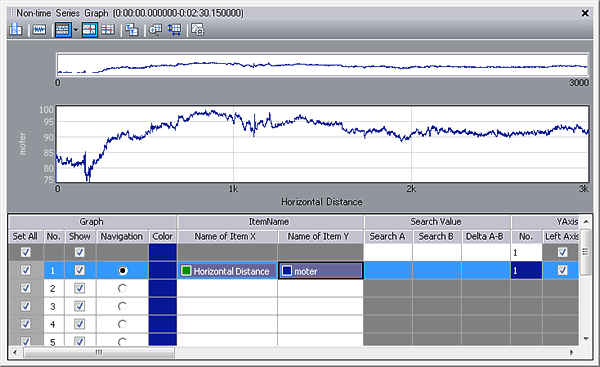
This function can display graphs at distance or angle etc excluding time as a lateral axis. For example, you can check when, where and how the vibration increases on the test course.
![]()
![]()
![]()
![]()
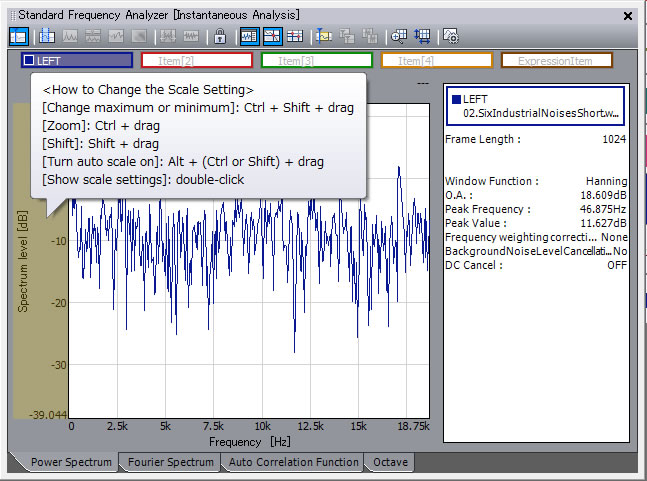
Standard frequency analysis / Cross frequency analysis
--Frequency range changing function
Frequency ranges can be changed when performing analysis; sampling in advance is no longer necessary.
Maximum FFT frame extended (32,768 ↁE65,536)
--Extended frame length
The maximum analysis frame length of 32,768 points has been extended to 65,536 points, allowing analysis with a greater frequency resolution.
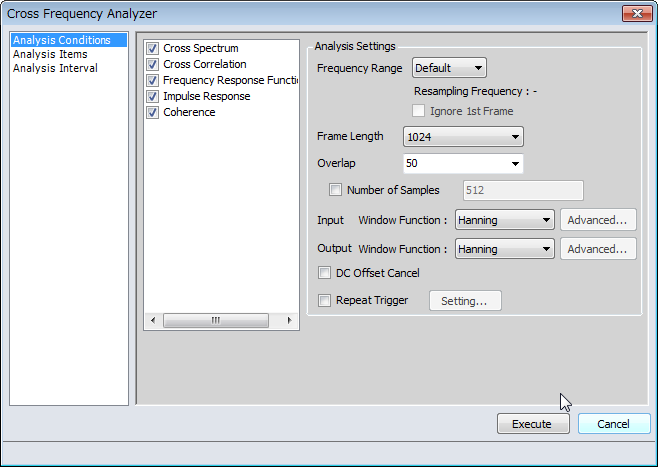
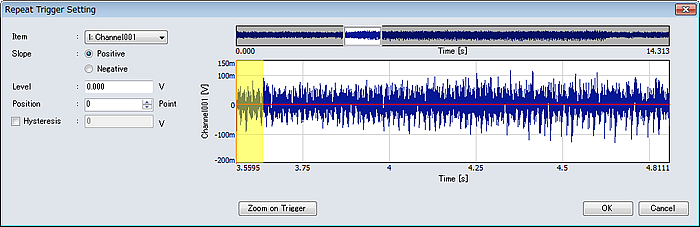
--Repeat trigger function
A repeat trigger function has been added. By setting a level trigger, the points where the trigger is hit in the analysis section can be analyzed to obtain the results. This function allows analysis to be performed at each point where hammering test data is entered and the average results to be determined.
--Customization of frequency weighting correction
It is possible to use reverse A-weighting and user-defined filters as a a frequency weighting correction.
--Enhanced calculation function
"ABS()"and "SQRT()"calculations are added.
Added SQRT function enables power summation of tri-axial data and evaluation of magnetic field.
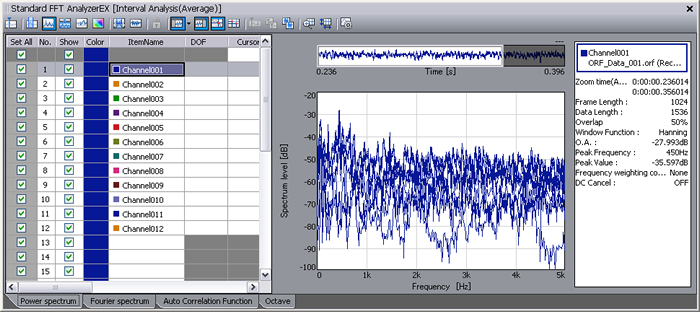
Standard frequency analysis EX / Cross frequency analysis EX
[Standard frequency analysis EX plug-in] and [Cross frequency analyzer EX plug-in] are included to the OS-0252 FFT analysis function (option).
The number of channels displayed in one analysis window was increased from 4 channels max. to 32 channels max.
This is very useful function to see power spectrums and frequency response waveforms at multiple measurement points in an overlap display. You can check the trend of the spectrums for repeated number of times by the overlap graph display.
Constant ratio tracking analysis is available with this optional software as well as constant width tracking analysis. Using this function, constant ratio tracking based on rotation speed can be performed
![]()
Time frequency analysis of the transient phenomena can be performed using Short time Fourier Transform, Wavelet conversion and Wigner distribution
Calculation speed of Wavelet conversion gets faster when the PC you use has multi-core CPU*1 or GPU*2.
*1: Calculation by the PC with CPU: Approx. 5 times (CPU: Corei7-930 2.8GHz)
*2: Calculation by the PC with GPD: Approx. 7 times (GPU: GeForce GTX560)
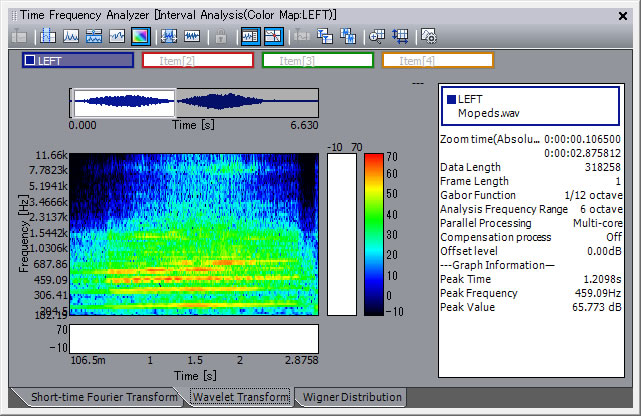
This analysis function is effective when the following situation.
1. For timbre evaluation of a musical instrument during a performance, it is not easy to see the state that frequency changes for broadband in short time by FFT Analysis.
2. It is difficult to capture the amount of feature (frequency) of the impulsive abnormal noise which is sometimes mixed in machine tool sound by FFT Analysis.
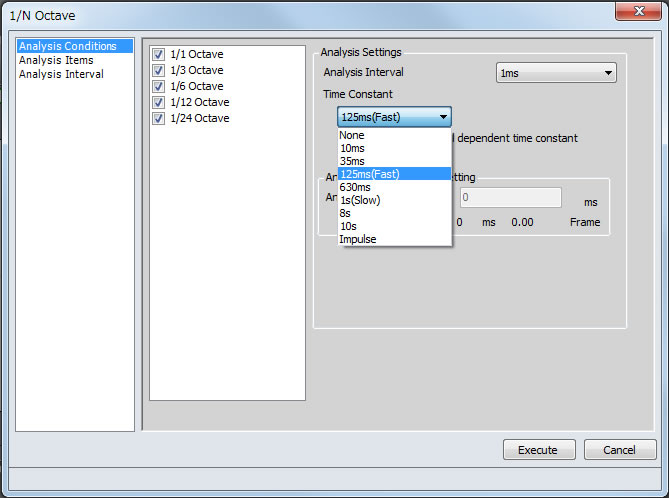
Choices time constant setting are available. 10ms, 35ms, 630ms and 8s can be set as time constant to support vibration measurement as well as 125ms (FAST) and 1s (SLOW) for acoustics measurement.
--G weighting correction
G weighting correction of 1/3 octave is added. It enables to evaluate affect of micro low frequency (standardized in ISO7196:1995) to human senses.
--Linear Leq
Result of 1/N octave can be obtained as linear Leq which conforms to JIS Z 8731:1999. Instantaneous value not including time constant value can be calculated.
--Y-axis linear scale
Y-axis in a graph can be displayed in both decibel and linear scale.
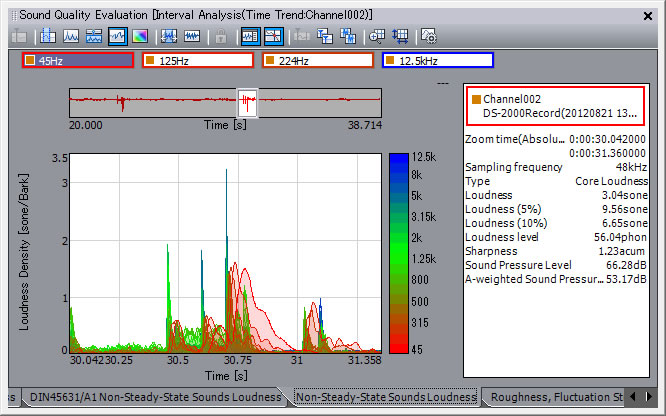
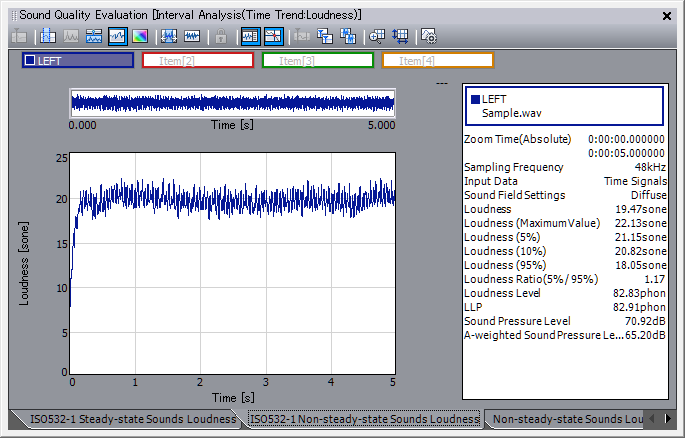
· Two analyses methods of ""ISO532-1"" are added: method for calculating loudness intended for stationary sounds, and method for calculating loudness intended for non-stationary sounds.
"LLE"* value is displayed on the avarage screen of ""ISO532-1 Stationary sound Loudness"", and "LLP"* value is displayed on the time trend and color map of ""ISO532-1 Non-stationary sound Loudness"
· Conforms to DIN 45631/A1 Non-stationary loudness which is the standard described in Deutsche Industrie Normen.
· In stationary loudness (ISO 532B) and non-stationary loudness, the analysis result can be checked every 0.1 Bark with Bark display mode.
· Three kinds methods of calculating the sharpness of ISO 532B stationary loudness have been added: DIN45692, Aures, and Bismarck.
(LLE is the loudness level obtained from the average energy value of the 1/3 octave band level used in the calculation of ISO532-1.
LLP is the loudness level obtained from the average energy value of the time-series data (2ms interval) calculated in the calculation of ISO532-1 Non-steady-state Sounds Loudness.)"
This function becomes available for OS-2500 and OS-2600 as well as OS-2700 series. (Used to be optional for the OS-2500 and OS-2600.)
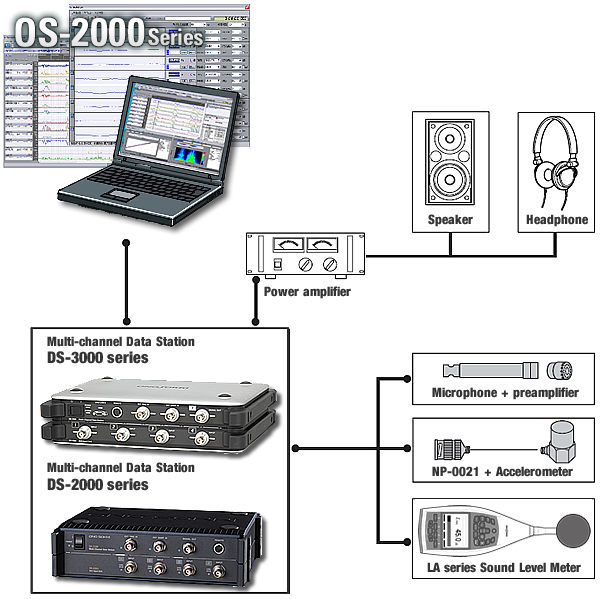
Data transfer from the DS-3000 series Data Station
Data recorded on the DS-3000 series Data Station can be immediately transferred to the OS-2000 series with a single button, which facilitates detailed analysis and data comparison.
![]()
Recording and playback function (OSRECO)are available for the DS-3200 (equipped with USB3.0).
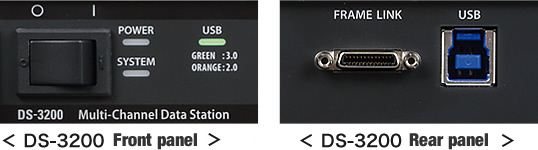
*DS-0366 (2-ch 100kHz input unit), DS-0373 (1ch 100 kHz output unit) cannot be used with.
*Not supports unit connecting function (FRAME LINK).
Recording and Playback (OSRECO) of DS-3000 series Data Station
Data of DS-3000 series can be recorded and played Recording available up to 102.4 kHz of sampling frequency (DS-3000 series. 8 channels).
Connecting interface can be selected in accordance with your PC. (PCI Express, PC card, Express card, or USB)
Max. sampling frequency to be recorded
| Number of input channels | 1 to 4 | 5 to 8 |
|---|---|---|
| DS-2000 series | 102.4 kHz | 51.2 kHz |
| DS-3000 series | 102.4 kHz | |
OSRECO (recording and playback function) can be used on the 64-bit version of Windows 7. (OS-2000 series ver.2.7 or later)
The DS-0299/DS-0399 is required when recording on the DS-2000/3100 series.
[Frequency analysis plug-in] is included in optional OS-0251: Statistics Analysis.
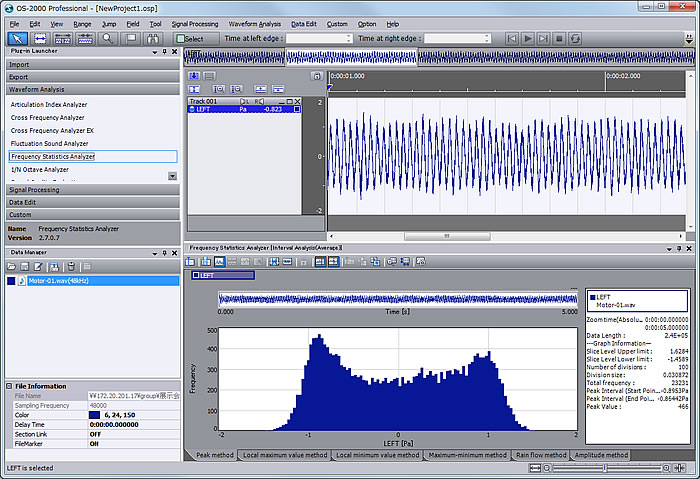
Vehicle, machinery, and structural object are affected by vibration irregularly changed. To capture the changing phenomena over time accurately, it is important to grasp the quantity and the rate that the phenomenon occur. This function can show the extreme value or amplitude value such as stress or vibration acceleration as histogram by using various processing technique. Various kinds of phenomena can be captured.
The following algorithms are used in Frequency Analysis of the OS-0251 Statistics Analysis.
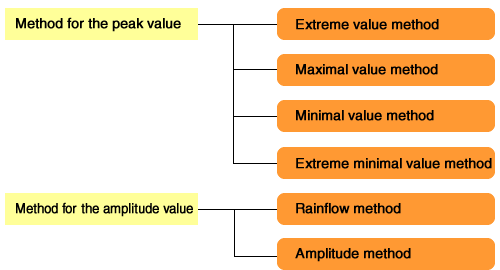
Extreme value method, Extreme maximum value method, Extreme minimum value method, Maximum minimum value method,
Rain flow method, amplitude method
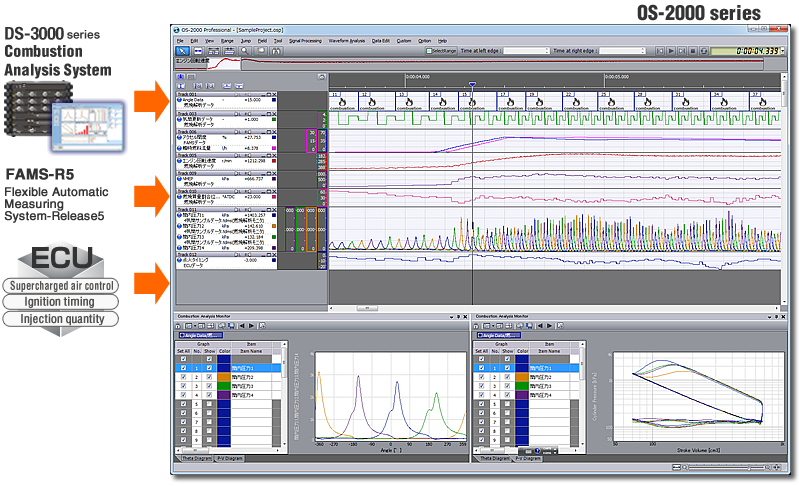
Supports DS-3000 Combustion Analysis System
Display of angle-axis data
The angle-axis data which is measured by the DS-3000 Combustion Analysis System can be displayed in the OS-2000 series.
θ diagrams and P-V diagrams can be displayed in the OS-2000 series along with the combustion analysis monitor (option) by selecting "cylinder pressure data Eof the imported angle-axis data which is measured by the DS-3000 Combustion Analysis System. Moreover, you can convert the angle-axes data into time-series data, and display and analyze this data side by side with other time-series data such as the performance data and ECU data.
1. The angle-axes data, performance data and ECU data can be displayed side by side in the OS-2000 series.
2. The synchronizer function allows easy-adjustment of the starting times of measurement data when they are misaligned. This reduces operation time.
3. The cylinder pressure data of angle-axes data can be easily displayed as the θ diagram and P-V diagram.
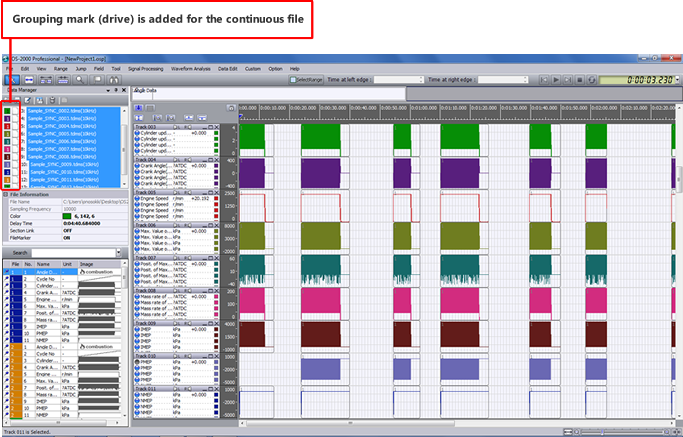
Display of divided TDMS format files as one continuous file
Multiple TDMS format files created by the SYNC measurement function (DS-0328) of the combustion analysis software (DS-0328) are displayed in one continuous file on the OS-2000 series software. This is effective for continuous analysis of start/stop of HEV or idling-stop.
When reading the TDMS file recorded by SYNC measurement function on the OS-2000 series software;
· Multiple divided files can be read at once.
· Display as a continuous file on the OS-2000 is available.
· Multiple files become one group and you can move all files in conjunction by aligning them.
· It is possible to draw multiple cycles of in-cylinder pressure in the combustion analysis monitor.