![]()
![]()
![]()

Fluctuation Sound Analyzer the OS-2760 is package software consists of the OS-2700 and plug-in options including fluctuation sound analyzer which is developed with new concept of sound quality evaluation parameter. This software makes clear sound features based on the two axes of frequency and fluctuating frequency by using new concept of [time fluctuation] as well as six parameters of physical quantities such as loudness, sharpness, roughness, fluctuation strength, AI (Articulation Index), tonality.
Roughness for representing the roughness of sound, or fluctuation strength for representing the fluctuation of sound serve is one of the analysis parameters based on time axis. But each parameter has an advantage and disadvantage when evaluating fluctuating sound in a wide range of frequencies. Fluctuation sound analyzer provides a parameter that is capable of dealing with a wide range of variable frequencies.
There are plenty of sounds that annoy you even though they are not so loud. The OS-2760 fluctuation sound analyzer can make clear features of such sound quality and perform more sophisticated analysis than conventional techniques. Using the OS-2760 achieves improving of sound quality, reducing cost of test, speed-up of development period and so on.
Features
Example of fluctuation sound analysis
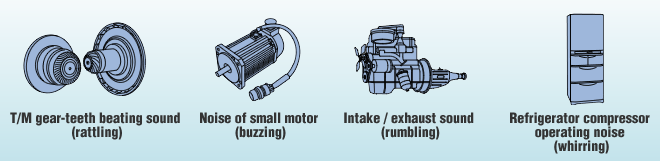
Knocking sound during fuel injection (humming sound)
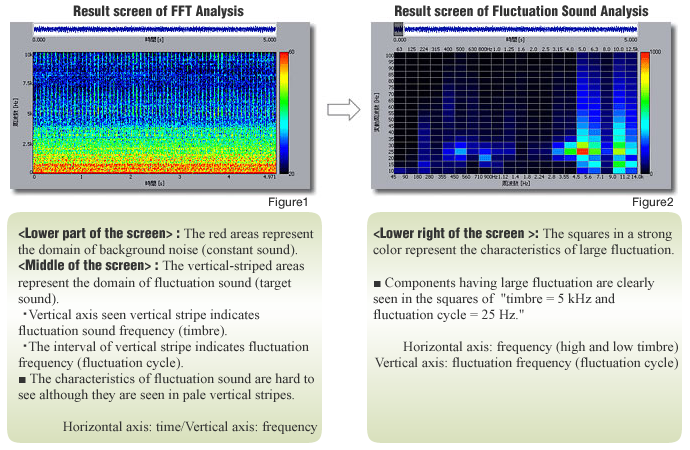
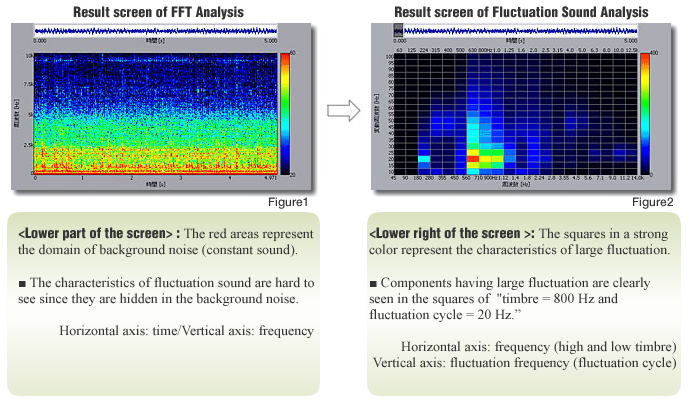
The figure1 on the below shows the result of performing FFT analysis. A striped pattern seen in the 5 kHz band is the humming sound. Since the background noise of the low frequency band (800 kHz or less) is high, it is extremely hard to extract this temporal fluctuating component from such a level. The figure2 shows the result of performing Fluctuation sound analysis for the same sound. The squares where the frequency axis (horizontal axis) representing the high and low timbre and the variable frequency axis (vertical axis) representing the period of temporal fluctuation intersect at 5 kHz and 25 Hz, are displayed in a strong color as characteristics of the humming sound.
T/M gear rattling noise<rattling noise>
Since the gear rattling noise having frequency components in the 800 Hz frequency band is hidden in the background noise, any characteristics cannot be found by FFT analysis (Figure1). The squares where the horizontal axis representing the timbre and the vertical axis representing variable period intersect at 800 Hz and 20 Hz, are displayed in a strong color as characteristics of the rattling noise (Figure2). Fluctuation sound analysis enables evaluation of various temporal fluctuation characteristics that can hardly be detected by the amount of the sound level.
Fluctuation sound simulator
With this simulator, the analysis result can be evaluated while adjusting the fluctuation components. You can eliminate only annoying fluctuation components and amplify only easy-to hear ones. Unlike standard bandpass filters which raise or lower the sound pressure level of the given band overall, this filter raises or lowers only fluctuation components without changing sound pressure levels. Fluctuation sound simulator can eliminate only the annoying fluctuation sound component while keeping the frequency characteristics as it is. The following is an example of eliminating rattling sound from an air outlet of the air conditioner with fluctuation sound simulator.
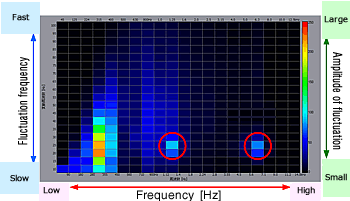
From the result of fluctuation sound alanlysis of the sound which is recorded at an air outlet of the air conditioner, you can find remarkable fluctuation components in two places circled in red.
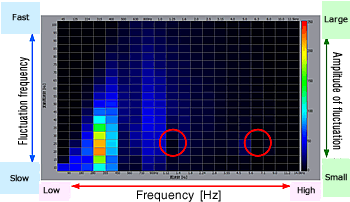
The above shows the result after elimination of fluctuation sound components by using fluctuation sound simulator. Remarkable fluctiation components and rattling sound are disappeared.
Frequency characteristics when the fluctuation component is eliminated using Sound fluctuation simulator
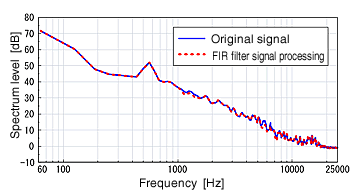
Frequency characteristics when the fluctuation component is eliminated using Bandpass filter
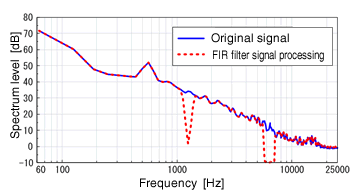
Fluctuation sound simulator makes it possible to adjust fluctuation components without great effecting to the frequency characteristics.
Basic specification
| Item | Specification | Remarks |
|---|---|---|
| Basic functions of Fluctuation sound analyzer |
Analysis interval averaging function | Minimum analysis interval 200 ms (When 0.5 Hz: analysis interval 4000 ms) |
| Analysis interval overlap | Any integer can be set. | |
| Variable frequency range selection function | A value between the lower limit of 0.5 Hz and the upper limit of 200 Hz can be set (in 0.5 increments). | |
| Variable frequency bandwidth selection function | A value between the minimum of 0.5 Hz and maximum of 100 Hz can be set (in 0.5 increments). | |
| Time trend display function | Four components can be overlaid at the same time. | |
| Masking effect ON/OFF function | ||
| Animation output function | Output of fluctuation sound analysis results synchronized to time waveforms. | |
| Loudness analysis function | Possible to display spectrum graph only |
Revised:2017/02/08