![]()
![]()
![]()
Report gallery
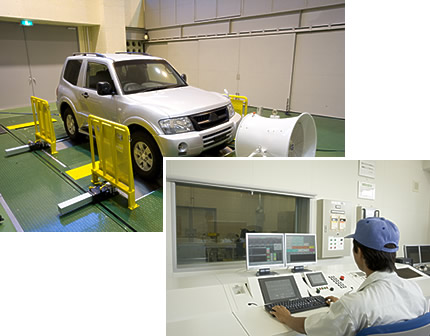
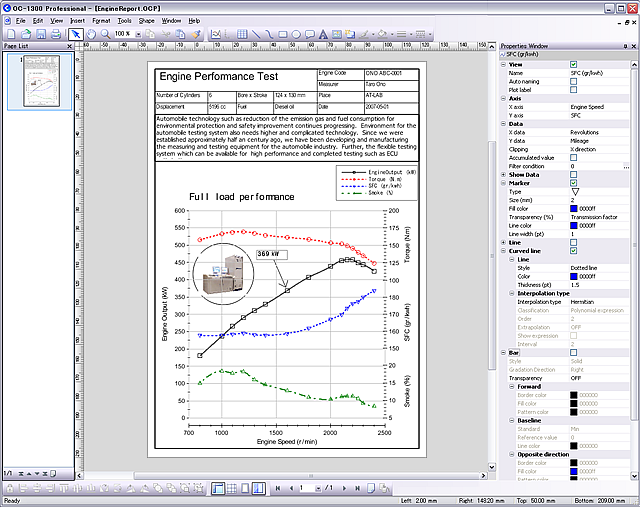
Report of Automobile Performance Test
The OC-1300 series responds to various needs for making complicated multi-axis graphs or contour line graphs of performance data, which are required data evaluation on site of automotive test. Original template files help for making more appealing day-to-day report in a short time. Anyone can create the required graph with such easy operations as drawing software.
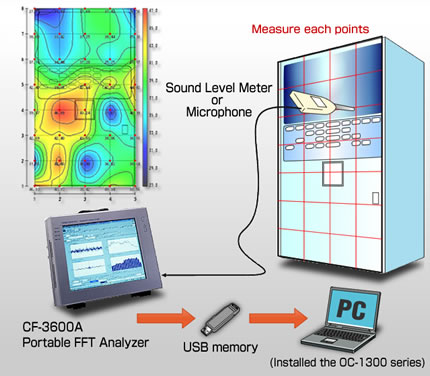
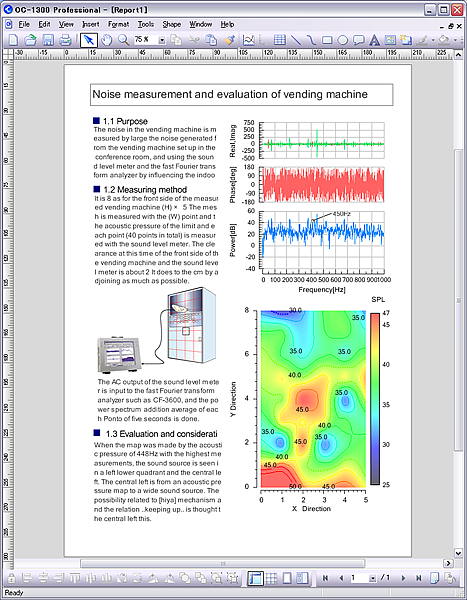
Sound evaluation report at product development / test production
A sound generation source or its distribution can be determined by mapping sound pressure level from sound source, which is measured by sound level meter (or microphone). A contour map of the obtained data created by the OC-1300 series is useful for effective noise reduction with the help of such detailed image. Moreover, appealing report can be created effectively by adding texts and figures with simple operation.
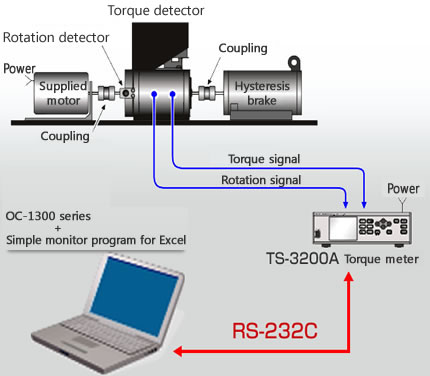
Example of motor torque measurement
Installing the TS-0325 RS-232C interface (option) enables operation of TS-3200 Digital torque meter on a PC such as measurement result storage or setting of the TS-3200. The measurement result data is able to be expressed in graphs by using OC-1300 and simple monitor program.
Report of prediction results / analyzed data
It is making advances in technology to visualize and predict various information by using analysis technique, which is created by natural environment or human social activity. The OC-1300 series can create high-value-added report from such huge volumes of data.