![]()
![]()
![]()
Features
Can be moved axis freely by dragging with a mouse
Axis can be laid out freely to create graphs exactly as you intended.
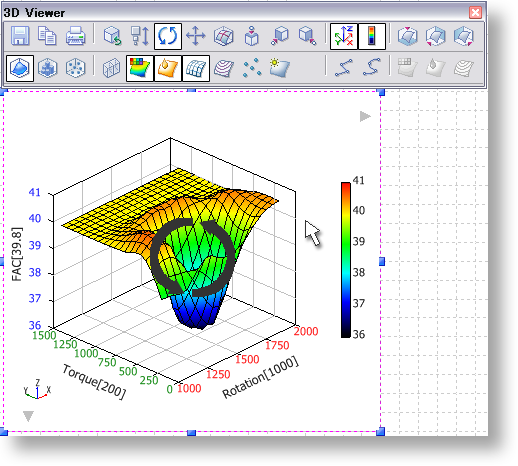
Easy creation of 3D graph with mouse operation
Direct operation enables speedier graph creation!
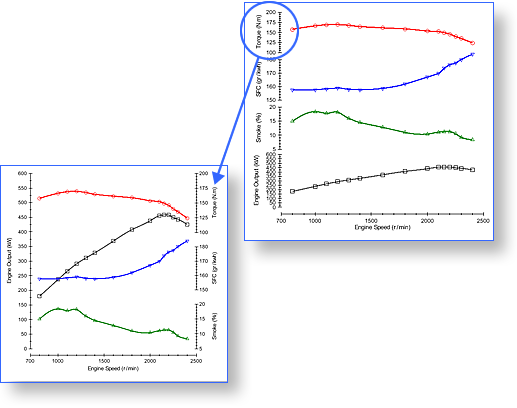
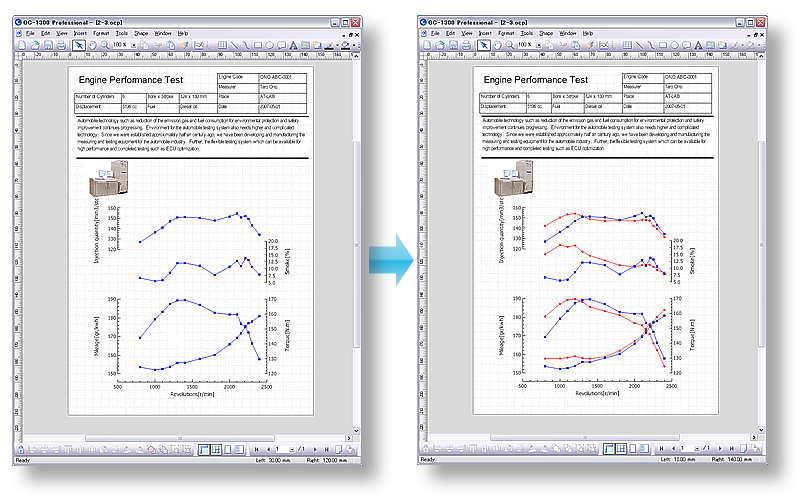
Useful function of Overlapping multiple graphs
You can display overlapping graph to compare to the measurement results in the past only by adding the data file. Lines or legends can be displayed for each file.
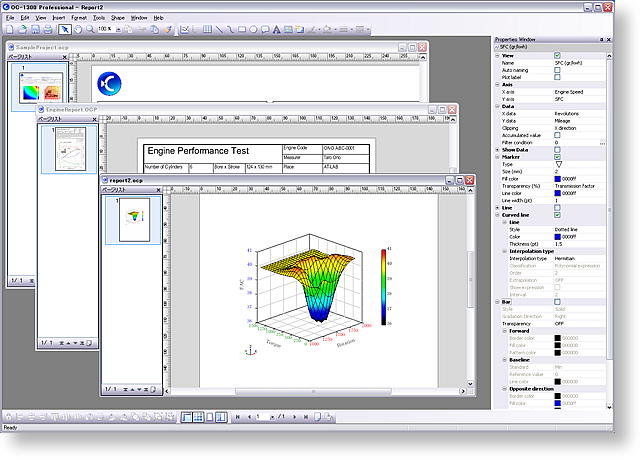
Easy-to-use Tool Windows
Tool Windows (Object, Properties, Data or Navigator) can be displayed in a Main Window of the OC-1300 series and arranged (docking, floating etc.) as panels at any location with mouse operation. You can also open multiple reports and display them as overlapping graph simultaneously in the OC-1300 series as well as resizing each window to any size.