![]()
![]()
![]()
Major function of the OC-1300 series
| Excel Add-in function | Add Plot |
|---|---|
| Search Cursor | |
| All Select | |
| Changing graph data range | |
| Adding axis to a graph | |
| Direct data transfer to OC-1300 series | |
| Inter-item operation (only for Professional) | |
| Thumbnail display function | |
| Main window | Docking window |
| Simultaneous display of multiple reports | |
| Tool bar | |
| Object | Drawsing curved line, comment, and baloon |
| Superscript or subscript | |
| Insert of a table | |
| Contour map | Cursor function (Only for professional) |
| Extract of a cross-section | |
| Scale label display adjustment (excluding Basic) | |
| Moving average | |
| Property window | |
| Page Bar | |
| Plane graph | |
| Line Type Editor | |
| Search Marker Label | |
| Waterfall | |
| Superimposed in a solid graph (Standard or more) | |
| Digital Array (Professional only) | |
| Adding a data file to all graphs | |
| Import file | Many kinds of format can be imported |
| [Reading multiple sheets together] command | |
| Import filter function | |
| SI prefix notation | |
| Viewer function | |
| Cube controller | Transparent display function |
| Consolidated function | |
| Display level narrowing function | |
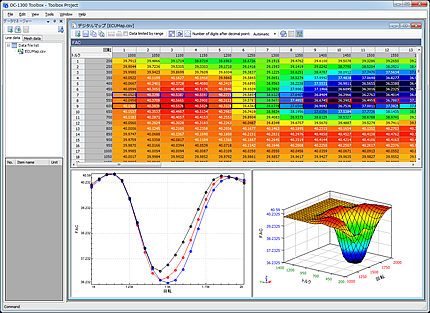
| Digital map | 3D Graph view |
| Section view (cross-section) | |
| Coloring table | |
| Base function | Conditional format is able to be apply to a list or text. |
| All the link text is created together. | |
| Various initial setting items | |
| Reproduction of a page | |
| Pages are able to be saved as images. | |
| Graphs and graphics are able to be saved as images. | |
| OC-0340 DAT Browser (OC-1300 Toolbox Function) | |
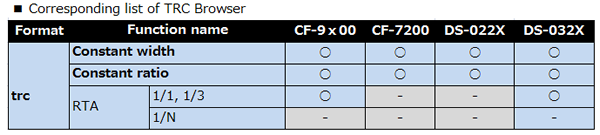
| OC-0341 TRC Browser (OC-1300 Toolbox Function) | |
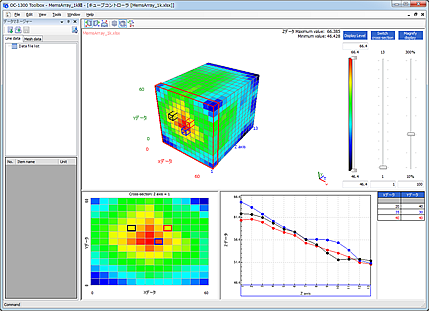
| OC-0330 Cube Controller | |
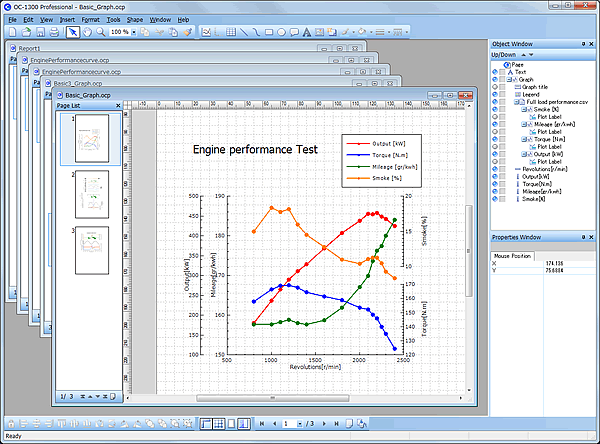
Major function of the OC-1300 series
Multi-axis graph or contour map can be directly created in an Excel. Graphs that cannot be drawn so far are possible to express in an Excel sheet. Functions of Add Plot, Search Cursor, All Select are available on planar graph which has been created on Excel Add-in function.
*Microsoft® Excel 2002 or later should be installed in a same PC.
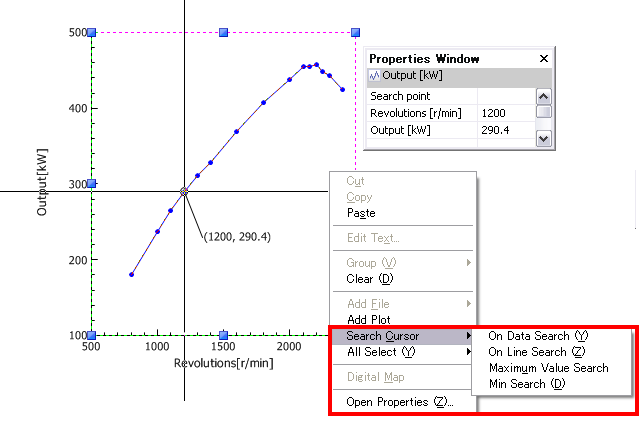
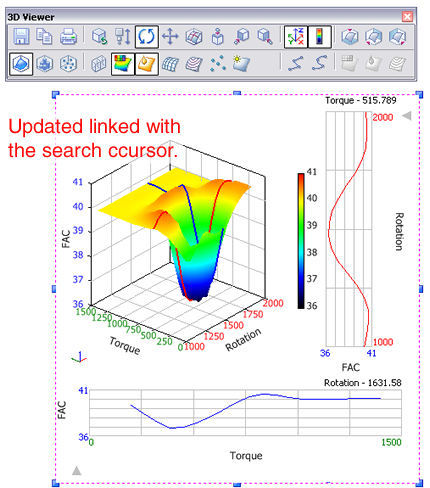
ADD Plot
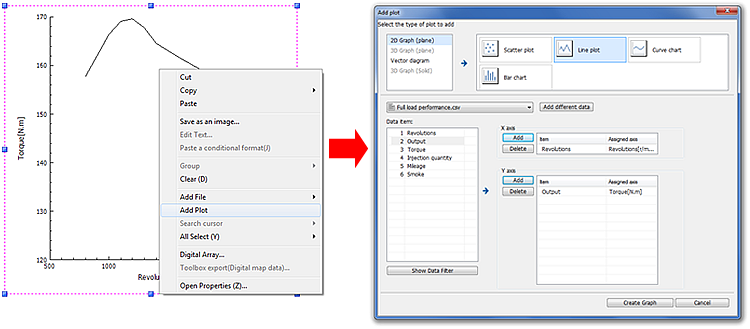
Search Cursor([On·Data Search(Y)]/[On·Line Search(Z)]/[Maximum Value Search(L)]/[Minimum Value Search(D)])
This function places the search cursor on the graph to search the plot data value or display the maximum and minimum values.
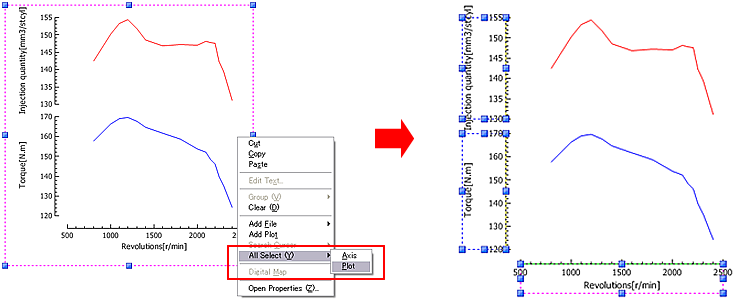
All Select(Axis/Plot)
Others
- Changing graph data range
- Adding axis to a graph
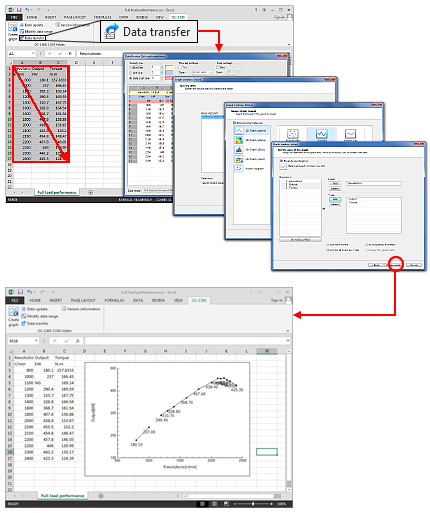
- Direct data transfer to OC-1300 series
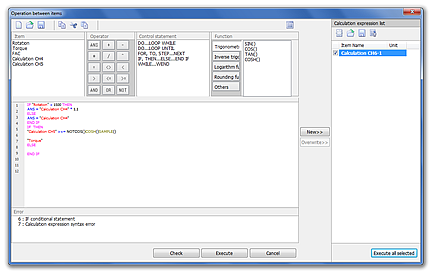
2. Inter-item operation (only for Professional)
Arithmetic operation, function and control character of each item can be combined and calculated.
You can see the contents of an each report on Explorer by Thumbnail display function without opening the project file.
Docking window
Object window, Property window, Data window and Navigator window can be freely arranged. Docking or floating to the top, bottom, left, right or any position in the window. The size of the each window can also be changed.
Simultaneous display of multiple reports
Reports can be displayed in cascade and displayed in parallel.
Tool bar
The tool bar includes the five types of the Standard Bar, Plotting Bar, Action Bar, View Bar and Page Bar. You can show or hide the toolbar by clicking the Toolbar command from the view menu.
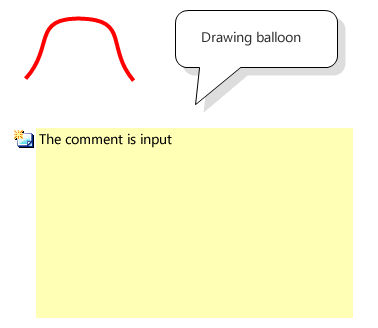
Drawing Curved line, comment, and Baloon
Options of object are increased such as curved line, comment, and balloon as well as Rectangle, Elipse, Straight line, and Text. You can specify the shadow settings for object.
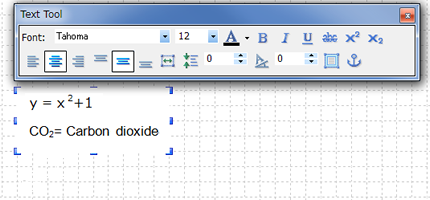
Superscript or subscript
The selected text is able to be superscript or subscript.
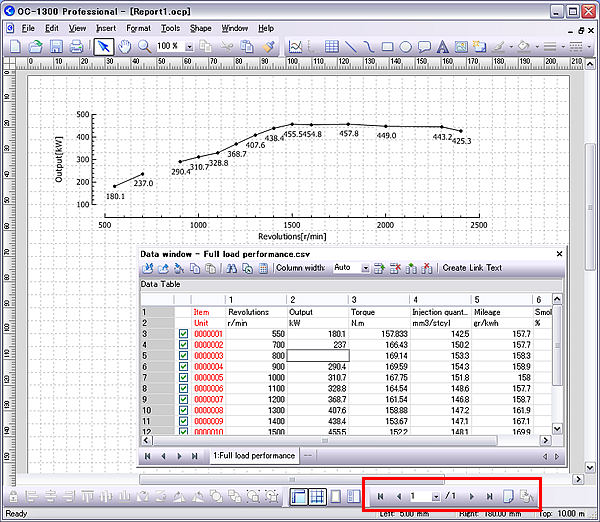
A table can be inserted on a report. Select from Insert menu. The table includes the following functions.
• Changing the column width, row height of a table
• Setting fill color for the table or cell
• Merging and unmerging cells
• Inserting columns or rows in a table
• Setting the cell borders
Cursor function (Only for professional)
Cursor is able to be displayed on contour map (solid).
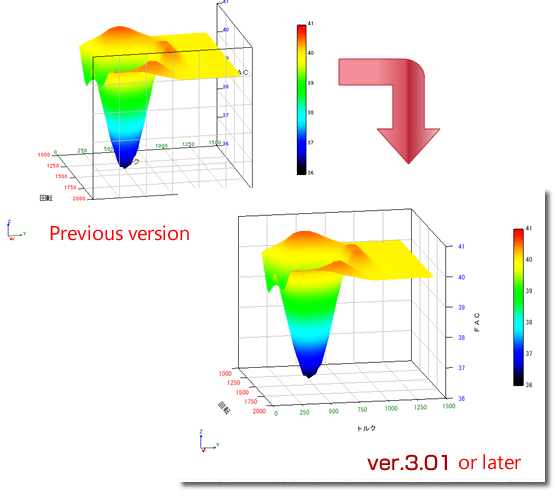
Scale label display adjustment (excluding Basic)
Scale label position of solid graph is adjusted automatically.
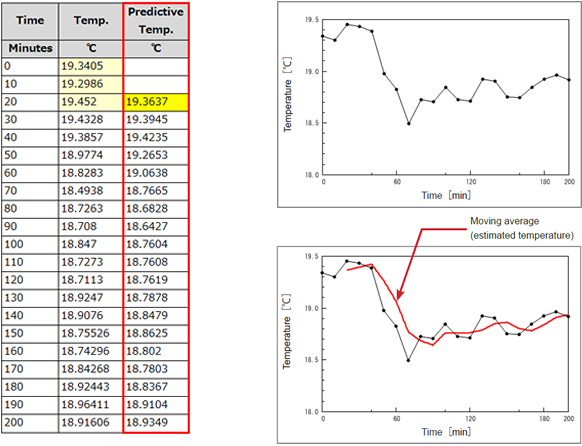
Interpolation type of curved line graph is selectable from Cubric spline, B spline, Hermitian, Regression curve, and Moving average.
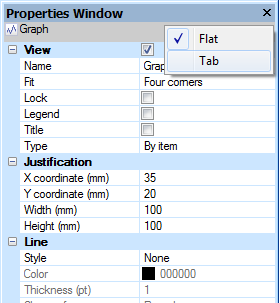
By right-clicking on the property window and selecting "Tab E items in the Property window is categorized. You can see the setting items immediately.
Page operation in the Page Bar even when the page list is hidden.
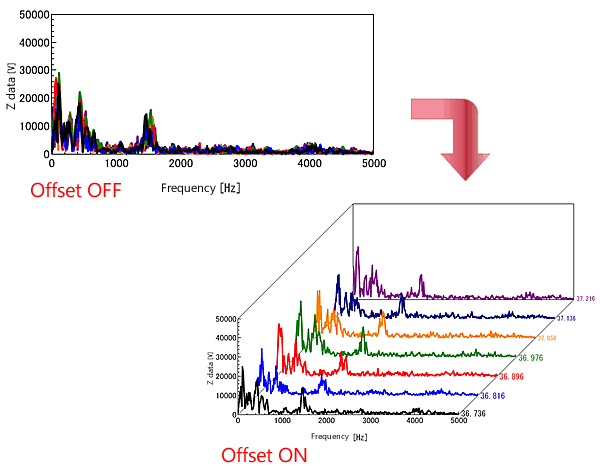
Each plot in superimposed graphs can be compared easily by switching the Offset to ON.
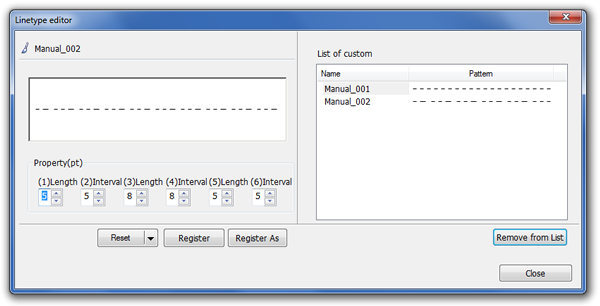
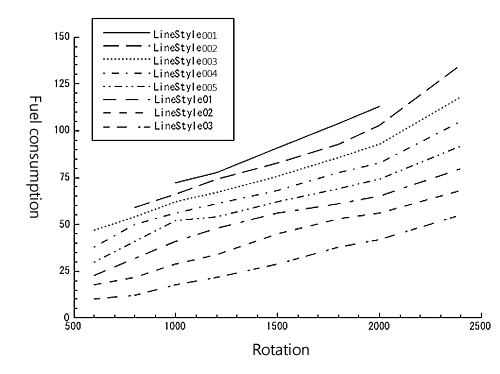
Used to create custom line types as well as preset line types in OC-1300 series. It can be used for plot lines etc.
You can rotate a Search Marker Label. The initial values of the angle or the display position are able to be changed.
Cross-section display of Waterfall graph Items or displays in Property window same as the other solid graphs are able to be set.
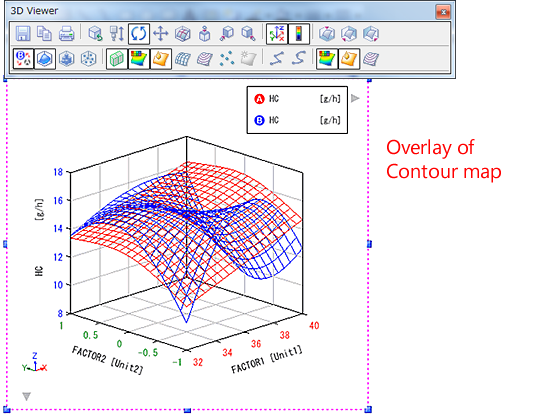
15. Superimposed in a solid graph (Standard or more)
2 plots are able to be superimposed in a 3D graph. Easy comparison of graph shapes in 3D
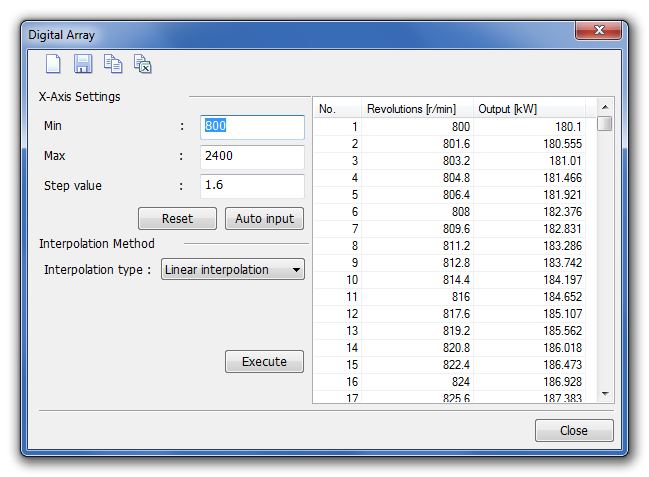
16. Digital Array (Professional only)
Digital Array is a function where in it is possible to enter X value of any step size from the data plot of 2D graph and see the result of interpolation (Y value) as a numeric value after calculation. The calculation method is selectable from the followings. Cubic spline / B spline / Hermitian analysis / Regression curve / Moving average / Straight line
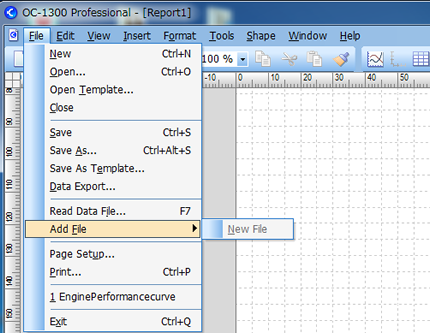
17. Adding a data file to all graphs
[Add File] command is added. If all the graphs on the template file have been created using data files with the same format, you can use the [Add file] command to add a data file to all the graphs at one shot.
Many kinds of format can be imported including Excel® file format (xlsx, xlsm).
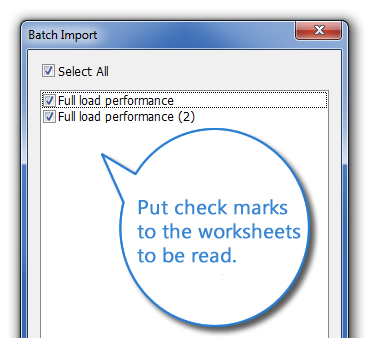
[Reading multiple sheets together] command
When an Excel (*.xls, *.xlsx, *.xlsm)book consisting of multiple worksheets is read, all sheets selected are read at the same time.
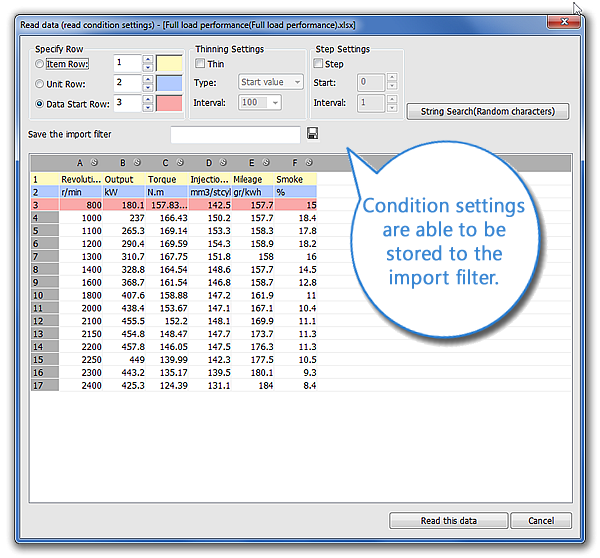
Import filter function
This function saves the each condition setting that every time you read the data. By creating an import filter, you can skip condition settings such as the item row, and so on. You can read the data easily just by specifying the data file and import filter.
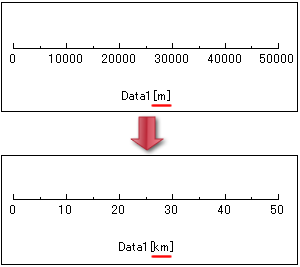
SI prefix is used for unit conversions of the axis scale labels and easy to see the numerical display of many digits. You can change the type of prefix. (Types: OFF/G/M/k/m/u/n/p)
This viewer provided free of charge allows viewing of OC-1300 project file even though you do not have the OC-1300 license version.
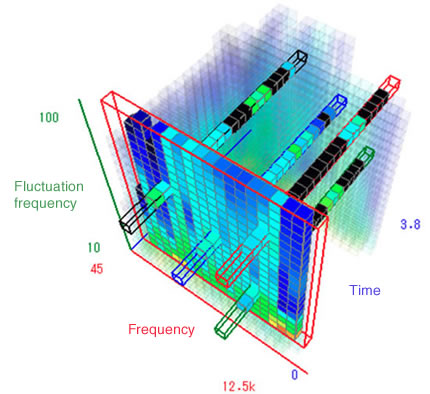
Cube controller can represent 4D data as a cube. Can also extract a cross-section, as well as consolidate data on a point and convert it to a graph.
Transparent display function
This function makes transparent the data other than cross-section. It is possible to check the cross-section level together with the entire data.
Consolidated function
This function displays a line graph created by the consolidated data of cell that has been selected on the color grid.
Display level narrowing function
Only the data which has been narrowed by setting upper/lower-limit value of color bar by a level slider is displayed.
Digital map is the function to interpolate and output between the 3D data to arbitrary pitch width of mesh data. Functions of color indication of the cell and level adjustment of map cross section are added to enhance the map editing function
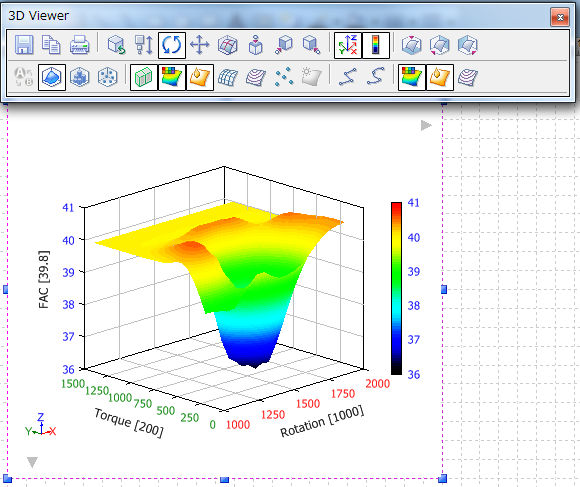
3D Graph view
Direct level adjustment by dragging a marker on a 3D graph.
Can be extracted the specified cross-section from 3D contour map.
Section view (cross-section)
Direct level adjustment by dragging the marker while checking the trend of the data.
Coloring table
Displaying map editing cell in level color helps level adjustment and level recognition visually in addition to numerical values.
Step value of Marker is able to be changed in Digital Map.
Conditional format is able to be apply to a list or text.
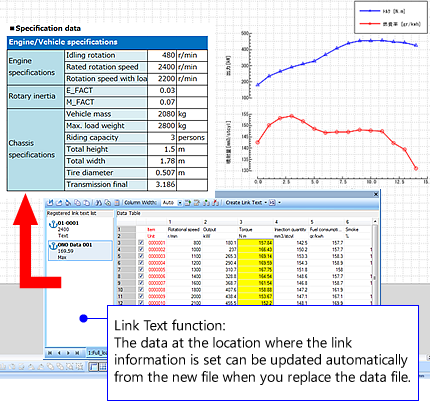
All the link text is created together.
Reproduction of a page
Pages are able to be saved as images.
Graphs and graphics are able to be saved as images.
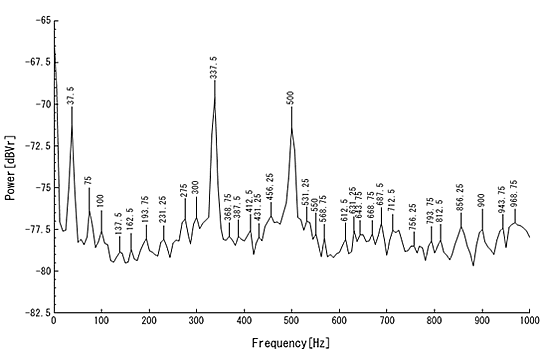
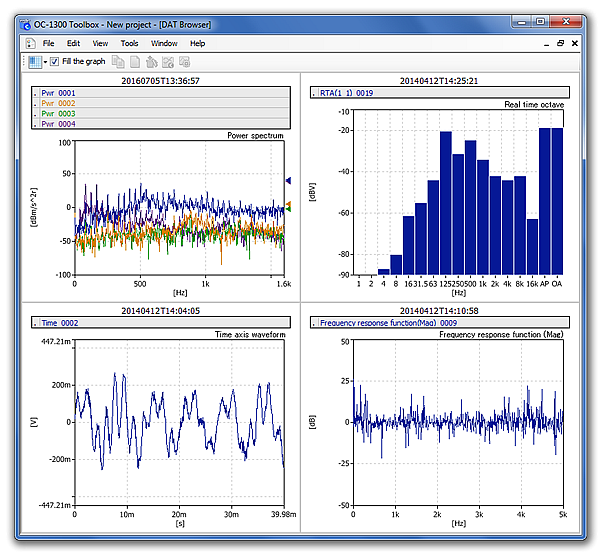
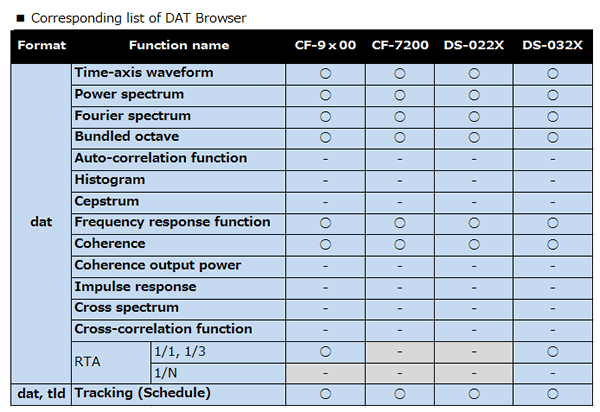
24. OC-0340 DAT Browser (OC-1300 Toolbox Function)
This is an option to display the data file which is analyzed in FFT or octave by the CF or DS series. Multiple graphs can be displayed in parallel in one window. The layout of the graph is capable of changing freely with a mouse operation. If graphs are in same function, overwrite is possible just by dropping the graph in a graph. Search cursor and peak search function are equipped as well.
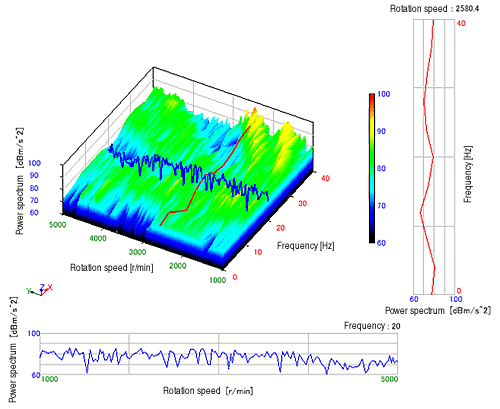
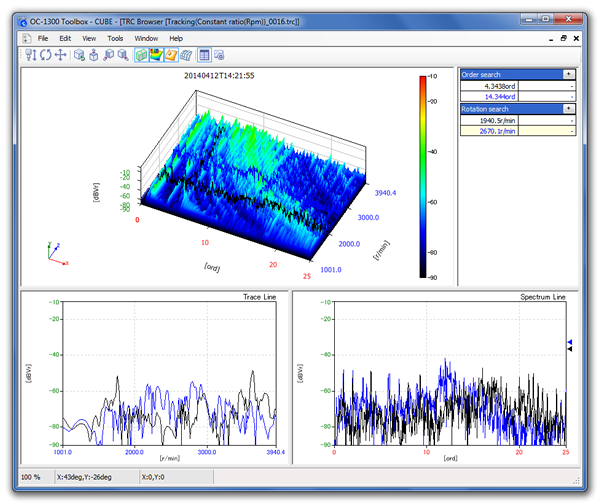
25. OC-0341 TRC Browser (OC-1300 Toolbox Function)
This is an option to display the 3D data file which is performed tracking (schedule) analysis by the CF or DS series. It is possible to create waterfall graph simply by dropping the data file in the window. Graph can be rotated in any angle with a mouse operation. If you search an order or frequency in the graph, simultaneous display of them as X/Y graphs are possible.
Cube controller is useful tool to catch the map appearance which is changed by time, temperature or other factors in addition to create the attractive graph. 4D data is able to be displayed sterically as a cube. It makes the data transparent other than cross-section. You can check the contents of the consolidated data blocks. Legend of the graph of consolidated data can be added.