
![]()
![]()
![]()
4ch Beam Forming software
BF-3100
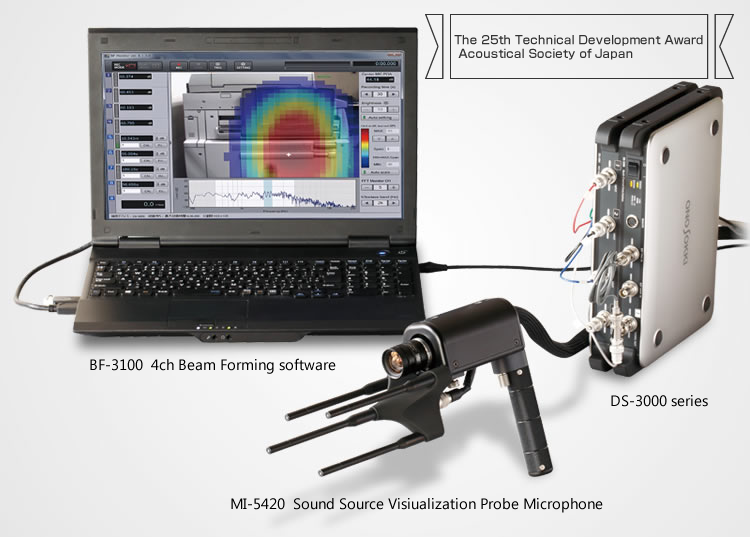
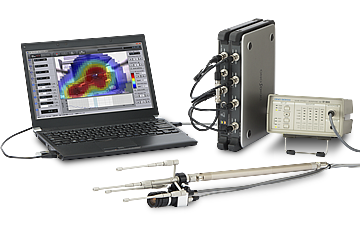
System example
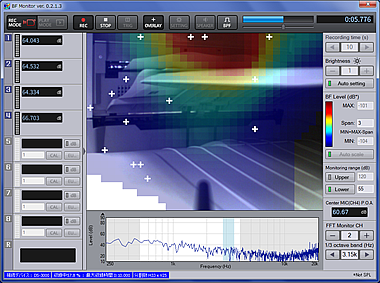
Real-time monitor software screen of BF-3100
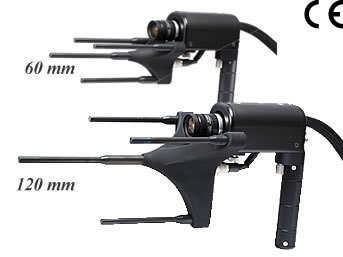
MI-5420 Sound Source Visualization
Probe Microphone 60 mm / 120 mm
BF-3100 4ch Beam Forming software is Sound Source Visualization software using Beam Forming and the calculation method that Ono Sokki has originally developed. Compact and lightweight design using only 4 microphones provides good portability and wide range of measurement area. It is possible to locate the sound source while moving the microphones and changing the frequencies of the analysis, even at a small space.
New microphone probe MI-5420 has two types of probe heads that are used on different frequency range. In response to requests, MI-5420 has achieved measurement of both high and low frequency, more than 5000 Hz and 1000 Hz or less*.
*60 mm microphone interval: 1000 to 8000 Hz
120 mm microphone interval: 500 to 4000 Hz
4ch Beam Forming software consists of Real-time monitor software and Offline analysis software. The real-time monitor software performs sound source visualization 5 times per second, and displays the analysis results with the video data of the installed camera.
Also, the real-time monitor software includes recording function of sound and video. The offline analysis software which is plugged in the OS-2000 performs the sound source visualization 25 times per second. By using the frequency analysis function and filter processing function, you can analyze the recorded sound or video to search when and where unexpected sounds are occurring.
Click below to watch a video about 4ch Beam Forming
Features
• Visualizing Sound Source using only 4 microphones
BF-3100 finds out the sound source location accurately by new calculation method of Beam forming using merely 4 microphones.
• Real-time monitoring of sound source (5 times/sec)
You can monitor the occurring sound in real-time with eyes while hearing it.
• Offline analysis of transient/impulsive sound
As for sounds difficult to reproduce or change very quickly, offline analysis using recorded data is effective. BF-3100 can perform further analysis of the unexpected transient/impulsive sound with high time resolution by offline analysis.
• Measurement in wider analysis frequency
Sound source searching from 500 Hz to 8 kHz (recommended analysis frequency)
• Compact and lightweight. Use it anywhere, anytime
Newly designed compact microphone probes provide good portability and make it easy to perform Sound Source Visualization even at a small space.
Application Examples of Sound Source Visualization System
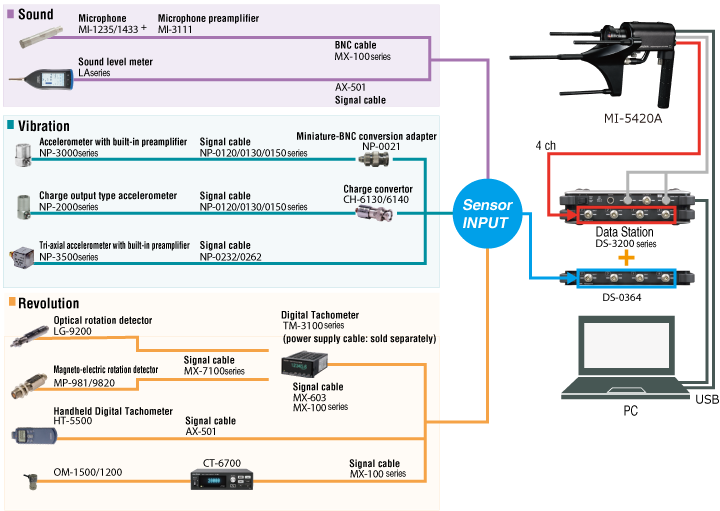
Measurement system for Sound Source Visualization
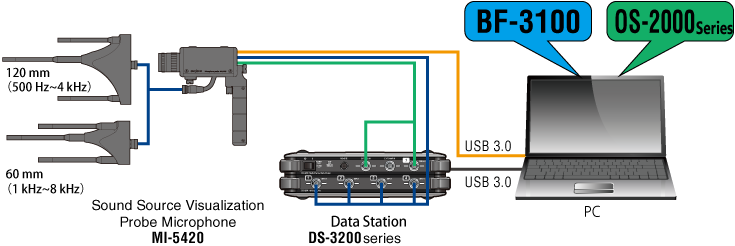
Sound Source Visualization system includes the latest FFT Analyzer DS-3200 series Data Station as a measurement unit and Sound Source Visualization Probe Microphone (MI-5420). BF-3100 and OS-2000 series are used as analysis software.
Software
Two kinds of software the Sound Source Visualization System includes
Real-time monitor software
Recording frames: 25 times / sec.
This software performs and shows Sound Source Visualization in real-time (update: 5 times/sec.).
You can find sound source while moving the microphones and changing the frequencies of analysis.
Other than 4 channels to MI series microphones for Beam Forming, 4 input signals are received(up to 8 channels can be conected). Wide variety of sensor connection allows expanded analysis, such as monitoring vibration waveform and checking the number of rotations.
Offline analysis software
Offline analysis processing: 25 times/sec.
As for sounds that are difficult to reproduce or change very quickly, such as transient sound or impulsive sound, offline analysis is effective. It is possible to visualize the location of the sound source even for unexpected transient sounds with certainty because there is no data loss. In addition, abnormal characteristics of the sound can be detected by the use of OS-2000 series (Time-series data analysis software).
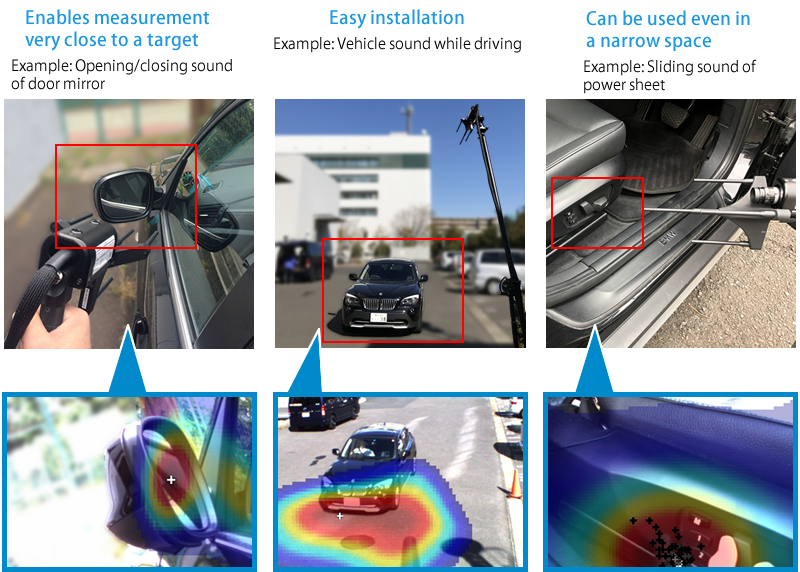
Examples of measurement
Wide variety of sensor connection allows expanding analysis (up to 8 input channels)
Measurement Example
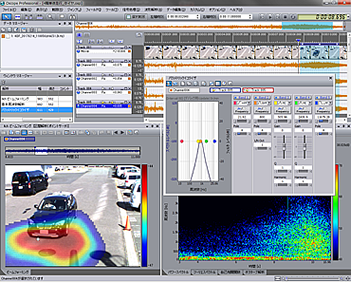
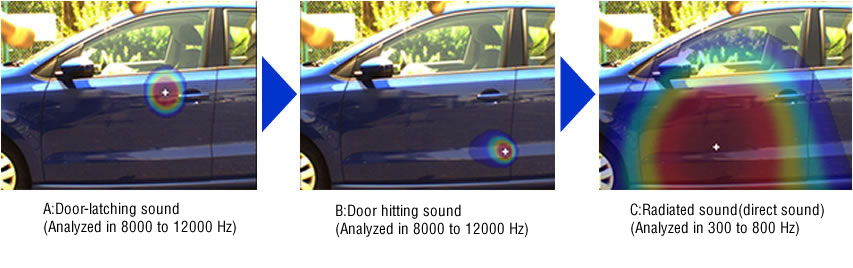
Time Sequence Analysis of Door Closing Sound
A sound creates the impression to be one single sound, but in fact, it is made of several sounds. The following is an example to analyze a door closing sound using 4ch Sound Source Visualization system including BF-3100 and OS-2000 series (Time series Data analysis software). OS-2000 series analyzes when and where the each sound has been occurred, and BF-3100 visualizes the sound source position. By setting the analysis time correctly, the time resolution can be improved.
[Analysis procedure]
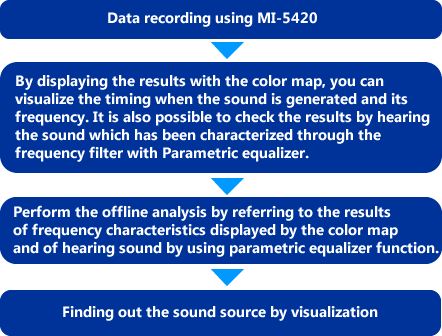
Fig.1 FFT Analysis color map screen
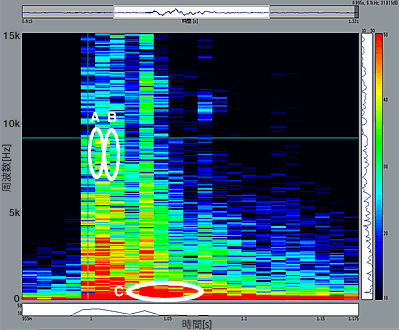
This is a door closing sound in color map by FFT Analysis. The more reddish area represents the higher sound pressure. The left Y-axis indicates the frequency and the X-axis indicates the time domain. The colored part shows the characteristics of that sound. To more detailed analysis, 4ch beam forming is performed by referring to the frequency and time enclosed by the circle.
Fig.2 Parametric equalizer screen
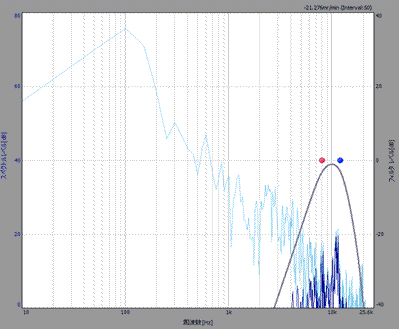
The sound viewing and hearing are performed with the parametric equalizer function. You can check what kind of sound it has generated by extracting the specific range of sound. In this example as in above image, the range of 8 to 12 kHz is extracted.
Figure
[Analysis result]
*Refer to the figure
Sound generating flow of door closing sound is as follows.
(A) High-pitched door-latching sound from the upper of the rear side > (B) Door hitting sound from lower of the rear side > (C) Low-pitched radiated sound from the center of the door
[Background of analysis]
According to the color map of Fig 1, the high sound pressure is concentrated in the band of 1 to 3 kHz (red part). When performing offline analysis in this band, the door-latching sound (A) and door-hitting sound (B) are buried in the reflected sound, and cannot be confirmed by the beam forming analysis. Those sounds ((A) and (B)) can be visualized by analyzing at a higher frequency.
Using both FFT Analysis and beam forming analysis, the characteristic frequency band in each A, B, and C is able to be analyzed.
By analyzing with different analysis time and frequency, it is possible to visualize and check that several sounds are occurring along with the time series even though it is heard as one sound with human ears.
Specification
MI-5420 Sound Source Visualization Probe Microphone
| Microphone intervals | 120 mm | 60 mm |
|---|---|---|
| Mass (probe+camera)* |
600 g or less | 500 g or less |
| Frequency range | 500 Hz to 4 kHz | 1 kHz to 8 kHz |
| Operating temperature range | 0 to +50 °C | |
| Storage temperature range | -10 to +60 °C | |
* Cable not included
Recording function (FFT Analyzer/camera image)
| FFT Analyzer | |
| Sampling frequency | 51.2 kHz |
|---|---|
| Recording frequency range | 20 kHz |
| A/D conversion | 24 bit |
| Number of channels | input 4ch (min.) to 8ch (max.) Recording of rotation speed by external sample input is available |
| Recording file format | ORF file (ONO SOKKI Original Format) |
| Camera image | |
| Number of pixels | VGA (640 x 480) fixed |
| File format | AVI Motion Jpeg format |
| Frame rate | 25 fps (recording) / 5 fps (monitoring) |
| Camera viewing angle | Horizontal: 42 ° Vertical: 26 ° |
| Image resolution | 640 x 480 |
| Common specification | |
| Maximum recording time | 20 min |
BF-3100/OS-2000 series (software)
| Beam Forming calculation | |
| Number of display split-screens of color map | 33 x 25 (fixed) |
|---|---|
| Number of FFT samplings | 2048 (fixed) |
| Window function | Rectangular |
| Band-pass filter setting band | Every 1/3 Octave band |
| FFT monitor | |
| Number of FFT samplings | 2048 (fixed) |
| Window function | Rectangular |
| Display frequency band | 250 Hz to 20 kHz |
| Offline analysis (OS-2000 series plug-in function) | |
| Number of display split-screens of color map | 33 x 25 to 161 x 121 |
| Frame length | 2048 (fixed) |
| Window function | Rectangular/Hanning/Force |
| Band-pass filter setting band | Every 1/3 octave band/custom |
| Others | |
| Output function | AVI/BMP/CSV/OC-1300 series |
| Data display | Data List/Time Trend Data |
| Hardware | DS-3200 | DS-3100 (Discontinued) | DS-2100 (Discontinued) |
|---|---|---|---|
| Software | DS-2000A series, DS-3000 series | ||
| Number of input channels | 4ch or more, 8ch max. | ||
| Required interface | - DS-0371 (Signal output)* |
DS-0399 (USB) DS-0371 (Signal output)* |
DS-0299 (USB) DS-0271A (Signal output)* |
| Specification | |
|---|---|
| Interface | USB3.0 x 1 (camera), USB3.0 x 1 (DS-3200) or USB2.0 x 1 (DS-0299/0399) USB2.0 or higher x 1 (license key) |
| Operating Systems | Microsoft® Windows® 7 Professional (62bit), Microsoft® Windows® 10 Pro (62bit) Installation of NET Framework3.5 Service Pack1 is required. |
| CPU | Intel® Core TM i5 2.7 GHz or more (recommend be at Intel ® Core TM i7) |
| DirectX | DirectX 9.0c or later (When OS-0281 is used.) |
| Memory | 4 GB or more |
| Hard disk | Free space 16 GB or more |
| Display | 1280 x 768 or more |
| Optical drive | In time of installation and update Optical drive that reading of DVD-R and CD-R is possible |
Product list
| Software | Product name | |
|---|---|---|
| BF-3100 | 4ch Beam Forming Sound Source Visualization software | |
| OS-2720 | OS-2000 series FFT analysis package | |
| OS-0281 | OS-2000 series video playback option | |
| OS-0261*1 | IIR filter (option) |
| Hardware | Product name | |
|---|---|---|
| MI-5420 | Sound Source Visualization Probe Microphone | |
| DS-3204 | 4ch 40 kHz main unit (4ch basic set: DS-3200&DS-0364) | |
| DS-0371*2 | 1ch signal output module for 40 kHz unit (built-in DS-3200) |
Sound Source Visualization System using MI-6420
4ch Beam Forming software can be used with the MI-6420 3D SI probe. The advantage of using MI-6420 is that it is available for three types of Sound Source Visualization methods of BF, EI, and SI.
MI-6420 also has 8 channels of input connector, and can measure while monitoring waveform of rotation or acceleration signal.
MI-6420 System example
MI-6420 3D SI probes
| Microphone installation interval | 60 mm (regular tetrahedron) |
|---|---|
| Dimensions | Total length 559 mm |
| Mass | Approx. 300 g |
| Recording frequency | 51.2 kHz |
| Analysis interval of monitor function | 5 times / sec. |
| Recommend analysis frequency | 1 kHz to 5 kHz (Though Beam Forming calculation is available at the frequency 1 kHz or less and more than 5 kHz, the accuracy is outside warranty. ) |
Product list
Related products
DS-3000 series Data Station
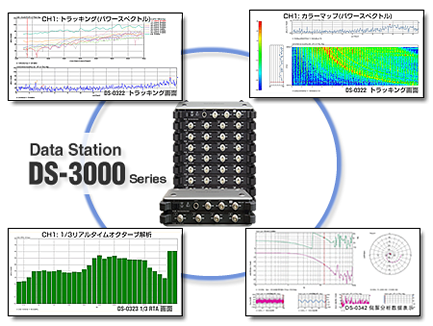
DS-3000 series Data Station is a PC-based FFT Analyzer with high performance and various functions. It succeeds advantages including high speed arithmetic processing, high reliability, good operability which have been accumulated over a long period of time. Real-time analysis capabilities has been improved more than twice compared to the previous model (DS-2000 series).
OS-2000 series Time-series Data Analysis Software
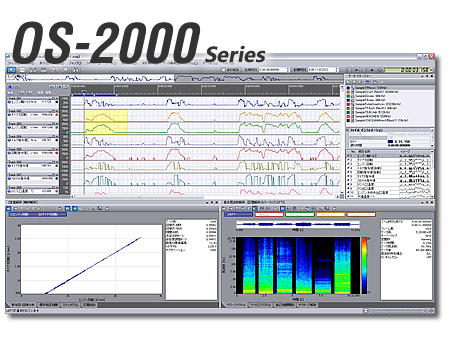
OS-2000 series has received good popularity as software to edit and analyze the long time series data freely which is not used by Excel.
Revised:2017/06/06