
![]()
![]()
![]()
Real-time 1/1, 1/3 Octave Analysis Software
DS-0223VA/0223WA/0223XA
2 ch/4 to 8 ch/10 to 32 ch
Replaces with DS-0223 Sereis
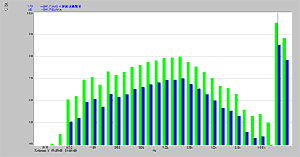
Example of noise measurement of arterial highway
Blue: Equivalent
Continuous Sound Pressure Level (Leq)
Green: Single-shot Sound
Exposure Level (Lae)
This software can perform 1/1 or 1/3 real-time octave band analysis from 2 to 32 channels at the frequency range of 0.5 to 20kHz. DS-0223VA is available for 2-ch, DS-0223WA is for 4 to 8-ch, and DS-0223XA is for 10 to 32-ch. Sound filter conforms to IEC, JIS and ANSI.
By setting the measurement time, Equivalent Continuous Sound Pressure Level and Single-shot Sound Exposure Level can be calculated simultaneously. Also, it can be recorded level fluctuation of each band (time-series) at maximum 2,000 points. Using those data, Percentile Sound Pressure Level for each band can be calculated. Operating system is Windows XP / VISTA/ 7 . Based on this software, the function can be expanded with optional software DS-0224A, 1/6, 1/12, 1/24 real-time octave analysis and DS-0243A, rotation-tracking analysis by real-time octave band.
Equivalent Continuous Sound Pressure Level: An average value which is obtained by dividing t-hour (s) of total level by t. Single-shot Sound Exposure Level: A value as converted t-hour (s) of level to one-minute of level.
What is Real-time octave analysis
When noise control countermeasure is taken, frequency analysis is required. Octave analysis has been used as one of the way for noise analysis. Octave represents the ratio of frequency is 1 to 2, that means 2 times of frequency. Feeling of human hearing has characteristics in equal ratio which respects to the frequency. In view of this feature, octave-band series is standardized based on the frequency at 1kHz. The sound pressure of each band is obtained through the standardized band-pass filter. The octave-band based on the frequency at 1kHz is called 1/1 octave-band, and then further division to three of 1/1 octave-band is called 1/3 octave-band.
Data example
Example of sound level trend (time history level) of excavator
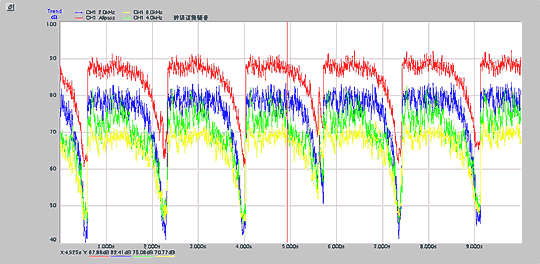
Red:All pass (total
level)
Blue:2kHz
Green:4kHz
Yellow:8kHz
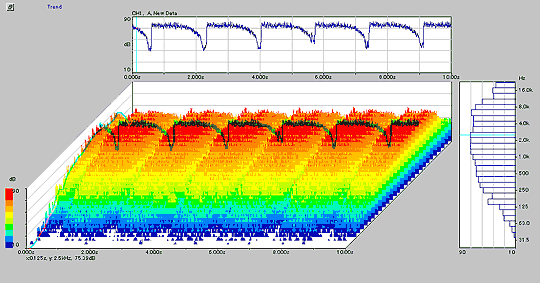
Example of level trend by 3D mapping display
Example of Percentile Sound Pressure Level at arterial highway (Lx)
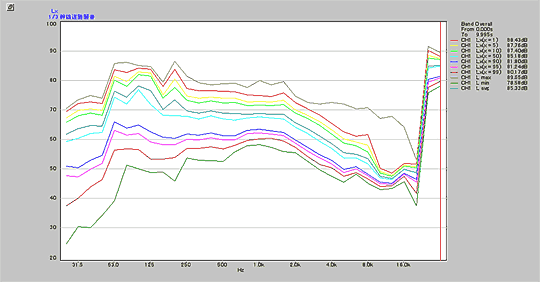
Display for L5 to L95, Lmax, Lmin, Lavg of each 1/3 octave-band with 2D graph
*Percentile Sound Pressure Level: It indicates the percentage of level in t-time. L50 is called central value,
which is the middle value counted from maximum level.
Specifications
(1) Input section
| Number of channels | 32 channels at maximum (simultaneous processing) |
|---|---|
| Input impedance | 1 MΩ / approx. 120 pF |
| Input voltage range | Applied every 10 dB, in 6 steps |
| Input connector | BNC voltage input, Applicable to CCLD 2 mA, 4 mA |
| Frequency weighting | A, B, C, FLAT (conforming to IEC 651 Type 0), analog filter |
| Sensitivity setting | Settable for each channel (calibration function) |
(2) Filter and detection section
| Calculation method | All digital calculation method (Digital filter and Digital RMS) |
|---|---|
| A/D conversion | 24 bit, 64 kHz sampling |
| Dynamic range | 85dB or more |
| Filter type | 6th Butterworth |
| Conforming standards (Filter) | JIS C 1514-2002 Class 1 IEC 61260 Ed.1.0 (1995) Class 1 ANSI S1.11-2004 Class 1 |
| Frequency range | 0.5 Hz to 20 kHz (1/3 OCT) 1.0 Hz to 16 kHz (1/1 OCT) |
| Time constant | 10 ms, 35 ms, FAST (125 ms), 630 ms, SLOW (1 s), 8 s, IMPULSE |
(3) Measurement section
| Measurable physical characteristics of sound | Sound pressure level for each band Sound pressure level of band composition (OVERALL) Sound pressure level of FLAT (ALLPASS) |
|---|---|
| Basic measurement | INST (Instantaneous value), MAX
(Maximum value for each second) MAX.H (Band maximum value within the measurement time for power operation data) MIN.H (Band minimum value within the measurement time for power operation data) P AVG (Average value of instantaneous values within the measurement time for power operation data, which is equivalent to the equivalent sound level) P SUM (Value obtained by converting the sum of instantaneous values within the specified measurement time for power operation data into the average power level for each second. Equivalent to the single-shot sound exposure level.) |
| Second processing | Lx (L1, L5, L10, L50, L90, L95, L99) Differential function(Difference of dB value, difference of antilog value (background noise correction) Level trend function(Plotting the graph showing level changing in arbitrary band, second processing after memorized) |
(4) Display section
| Display format | Bar graph display (Allband+Allpass+Overall) Monitor display (Time trend monitor display) List display (Allband+Allpass+Overall) Level trend display (from continuous recording band data) 3D/2D level trend display (color) |
|---|
(5) Memory section
| Memory capacity | 2000 blocks/ch, Continuous recording of INST data (level trend function) |
|---|---|
| Recording interval | 1 ms to 10 s (valiable) |
| Number of saving data | Up to 500 data items can be saved |
| Address for storing data | Can be stored to arbitrary folder with arbitrary file name. |
(6)Data input/output function
| Analysis condition file | Open/save of arbitrary measurement condition file |
|---|---|
| Print function of data | Print function by installing of printer driver |
| Copy function of data | Pasting data on clipboard at text or bitmap format |
Applications for real-time octave analysis
Applications
Revised:2013/11/13