
![]()
![]()
![]()
Here is an effective method to easily reduce noise by using a sound level meter (or microphone), instead of the sound intensity analysis by measuring the sound pressure level from the sound source, mapping the measured value, and obtaining the source of the sound and its distribution.
In general, for effective reduction of noise, sound intensity analysis is used to estimate the sound source position, calculate the amount of radiation from the sound source, and obtain the direction of the acoustic energy passing through the measurement surface etc. However, as it requires acoustic intensity probe and special software, it is not easy to measure and analyze on site.
This example shows how to detect the sound generating source of a vending machine installed in a conference room using a sound level meter and FFT analyzer to improve the sound environment in the conference room. For the mapping of the measured values, the result is shown using two types of spread sheet: Microsoft® Excel® and OC-1300 "graph creation tool."
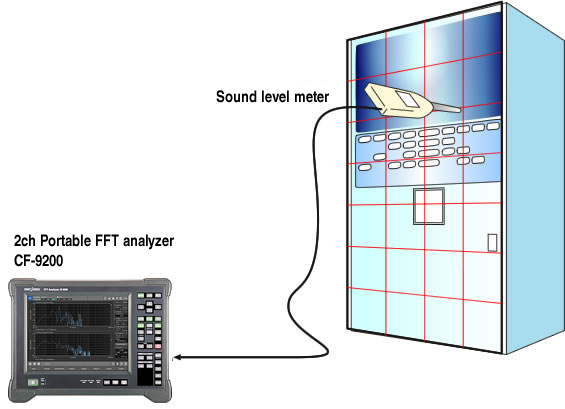
Configuration
| Model name | Product name | Remarks | |
|---|---|---|---|
| 1 | CF-9200 | Portable 2 ch/4 ch FFT Analyzer | Easy to perform measurement on site |
| 2 | LA-7500 | High performance sound level meter | MI series microphone is also available. |
| 3 | OC-1300 | Graph creation tool | Application software for creation of graphs and reports |
* Model name/product name is linked to each product information.
Measuring method
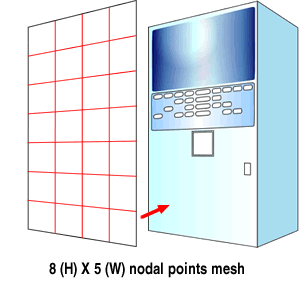
1. Separate the front surface of the vending machine to be measured into 8 (H) × 5 (W) nodal points and measure the sound pressure at each point (total 40 points) with a sound level meter. At this time, the clearance between the front surface of the vending machine and the sound level meter should be as close to 2 cm as possible.
2. Input the AC output of the sound level meter into the FFT analyzer such as CF-9200, and perform power spectrum addition averaging for each point for 5 seconds.
Here, the following conditions are set.
· Frequency range: 800 Hz
· Window function: hanning
Frequency range is set to 800 Hz. This time there is not any characteristic peak in frequencies above 800 Hz and the level is low.
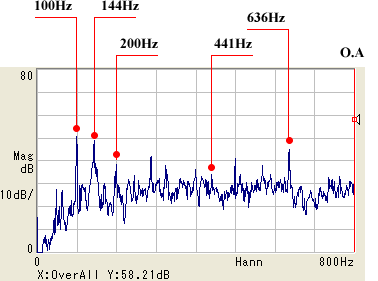
The above data shows the power spectrum of the point with the highest overall value (overall Y: 58.21 dB.)
3. Next, we will create an acoustic pressure map for each frequency component using Excel's® graph function (contour line) or OC-1300. For your reference, a list of overall acoustic pressure level up to the frequency component of 800 Hz is shown on the right.
| 54.74 | 54.04 | 53.90 | 53.90 | 53.10 |
| 55.29 | 55.69 | 55.59 | 55.35 | 54.02 |
| 55.62 | 55.84 | 55.77 | 55.51 | 54.26 |
| 56.55 | 55.50 | 55.50 | 54.91 | 54.62 |
| 55.88 | 56.08 | 55.73 | 55.23 | 53.95 |
| 56.28 | 56.59 | 56.60 | 55.52 | 53.85 |
| 57.37 | 58.21 | 57.33 | 56.03 | 54.23 |
| 58.14 | 57.84 | 57.27 | 55.77 | 53.90 |
(Unit: dB)
Analysis data example
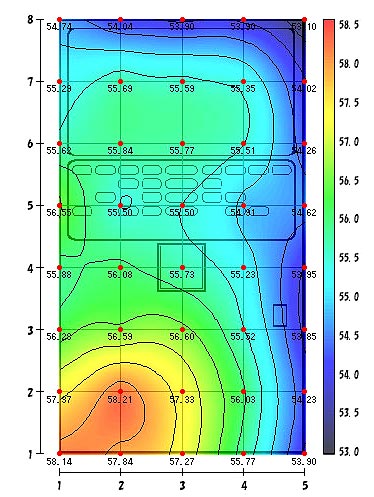
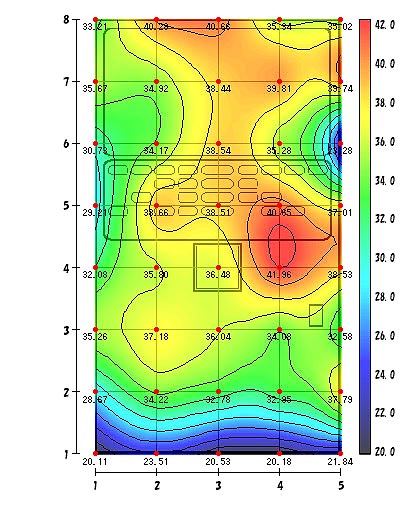
Acoustic pressure map of overall value (up to 800 Hz)
This is an acoustic pressure map of the overall sound level (up to 800 Hz). From this acoustic pressure map, you can recognize that the acoustic pressure level is the highest at the lower left section of the front surface of the vending machine, and it is supposed to be a noise sound source.
Excel®
OC-1300
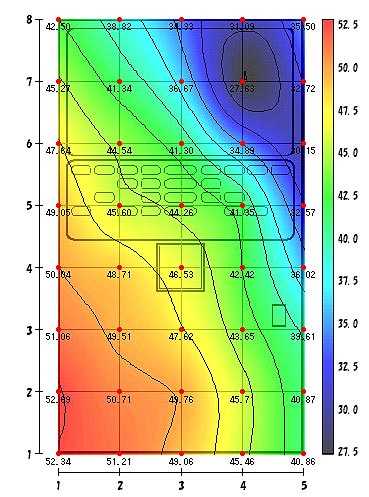
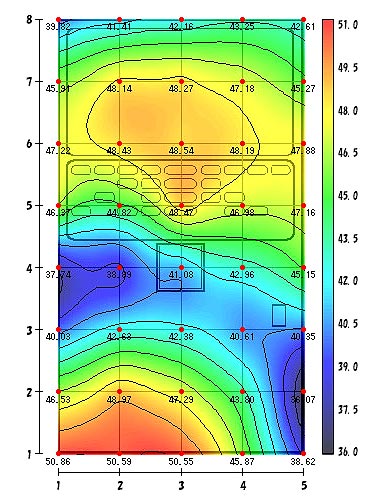
Acoustic pressure map at 100 Hz
You can see that the acoustic pressure is transmitted radially from the sound source at the lower left.
Excel®
OC-1300
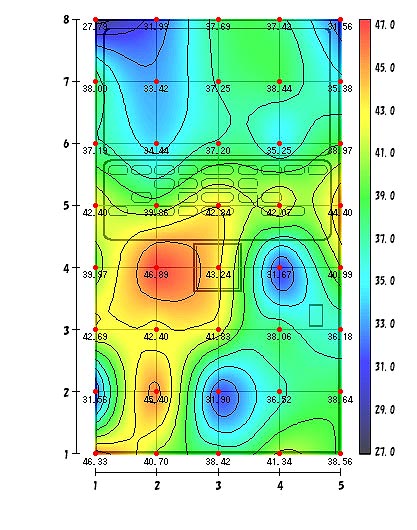
Acoustic pressure map at 144 Hz
The sound source at the lower left section matches, but a sound source is also seen in the upper section of the center. As the position is covered with an acrylic plate, possibility of resonance is considered.
Excel®
OC-1300
Acoustic pressure map at 200 Hz
A sound source is seen at the lower left section, but there are places where high acoustic pressure is seen in the center left and the right upper section. The center left is the section that provides cold drinks and you can assume that it is related to the cold insulation mechanism.
Excel®
OC-1300
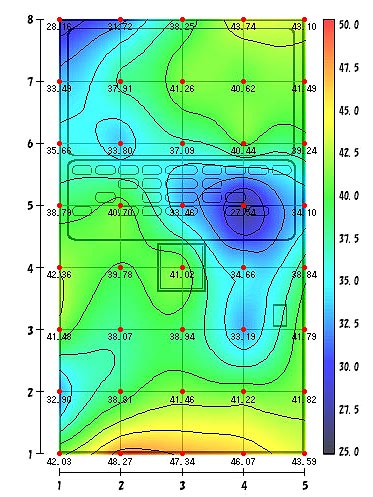
Acoustic pressure map at 441 Hz
It shows an acoustic pressure map uncorrelated with the sound source at the lower left section. The position of the sound source is considered to be a coin insertion section. It seems unrelated to the noise of the inverter and that individual measurements are necessary.
Excel®
OC-1300
Acoustic pressure map at 636 Hz
You can see the sound source at the lower left and the center left. From the acoustic pressure map, the sound source occupies the center left side widely. As same as 200 Hz case, the noise from the center left area can be related to the cold insulation mechanism.
Excel®
OC-1300
*The transparency in the OC-1300 contour diagram above is set to 40%. Contour transparency setting is implemented in ver. 1.10 and later versions of OC-1300.
Key points
|
Revised:2018/10/31