![]()
![]()
![]()
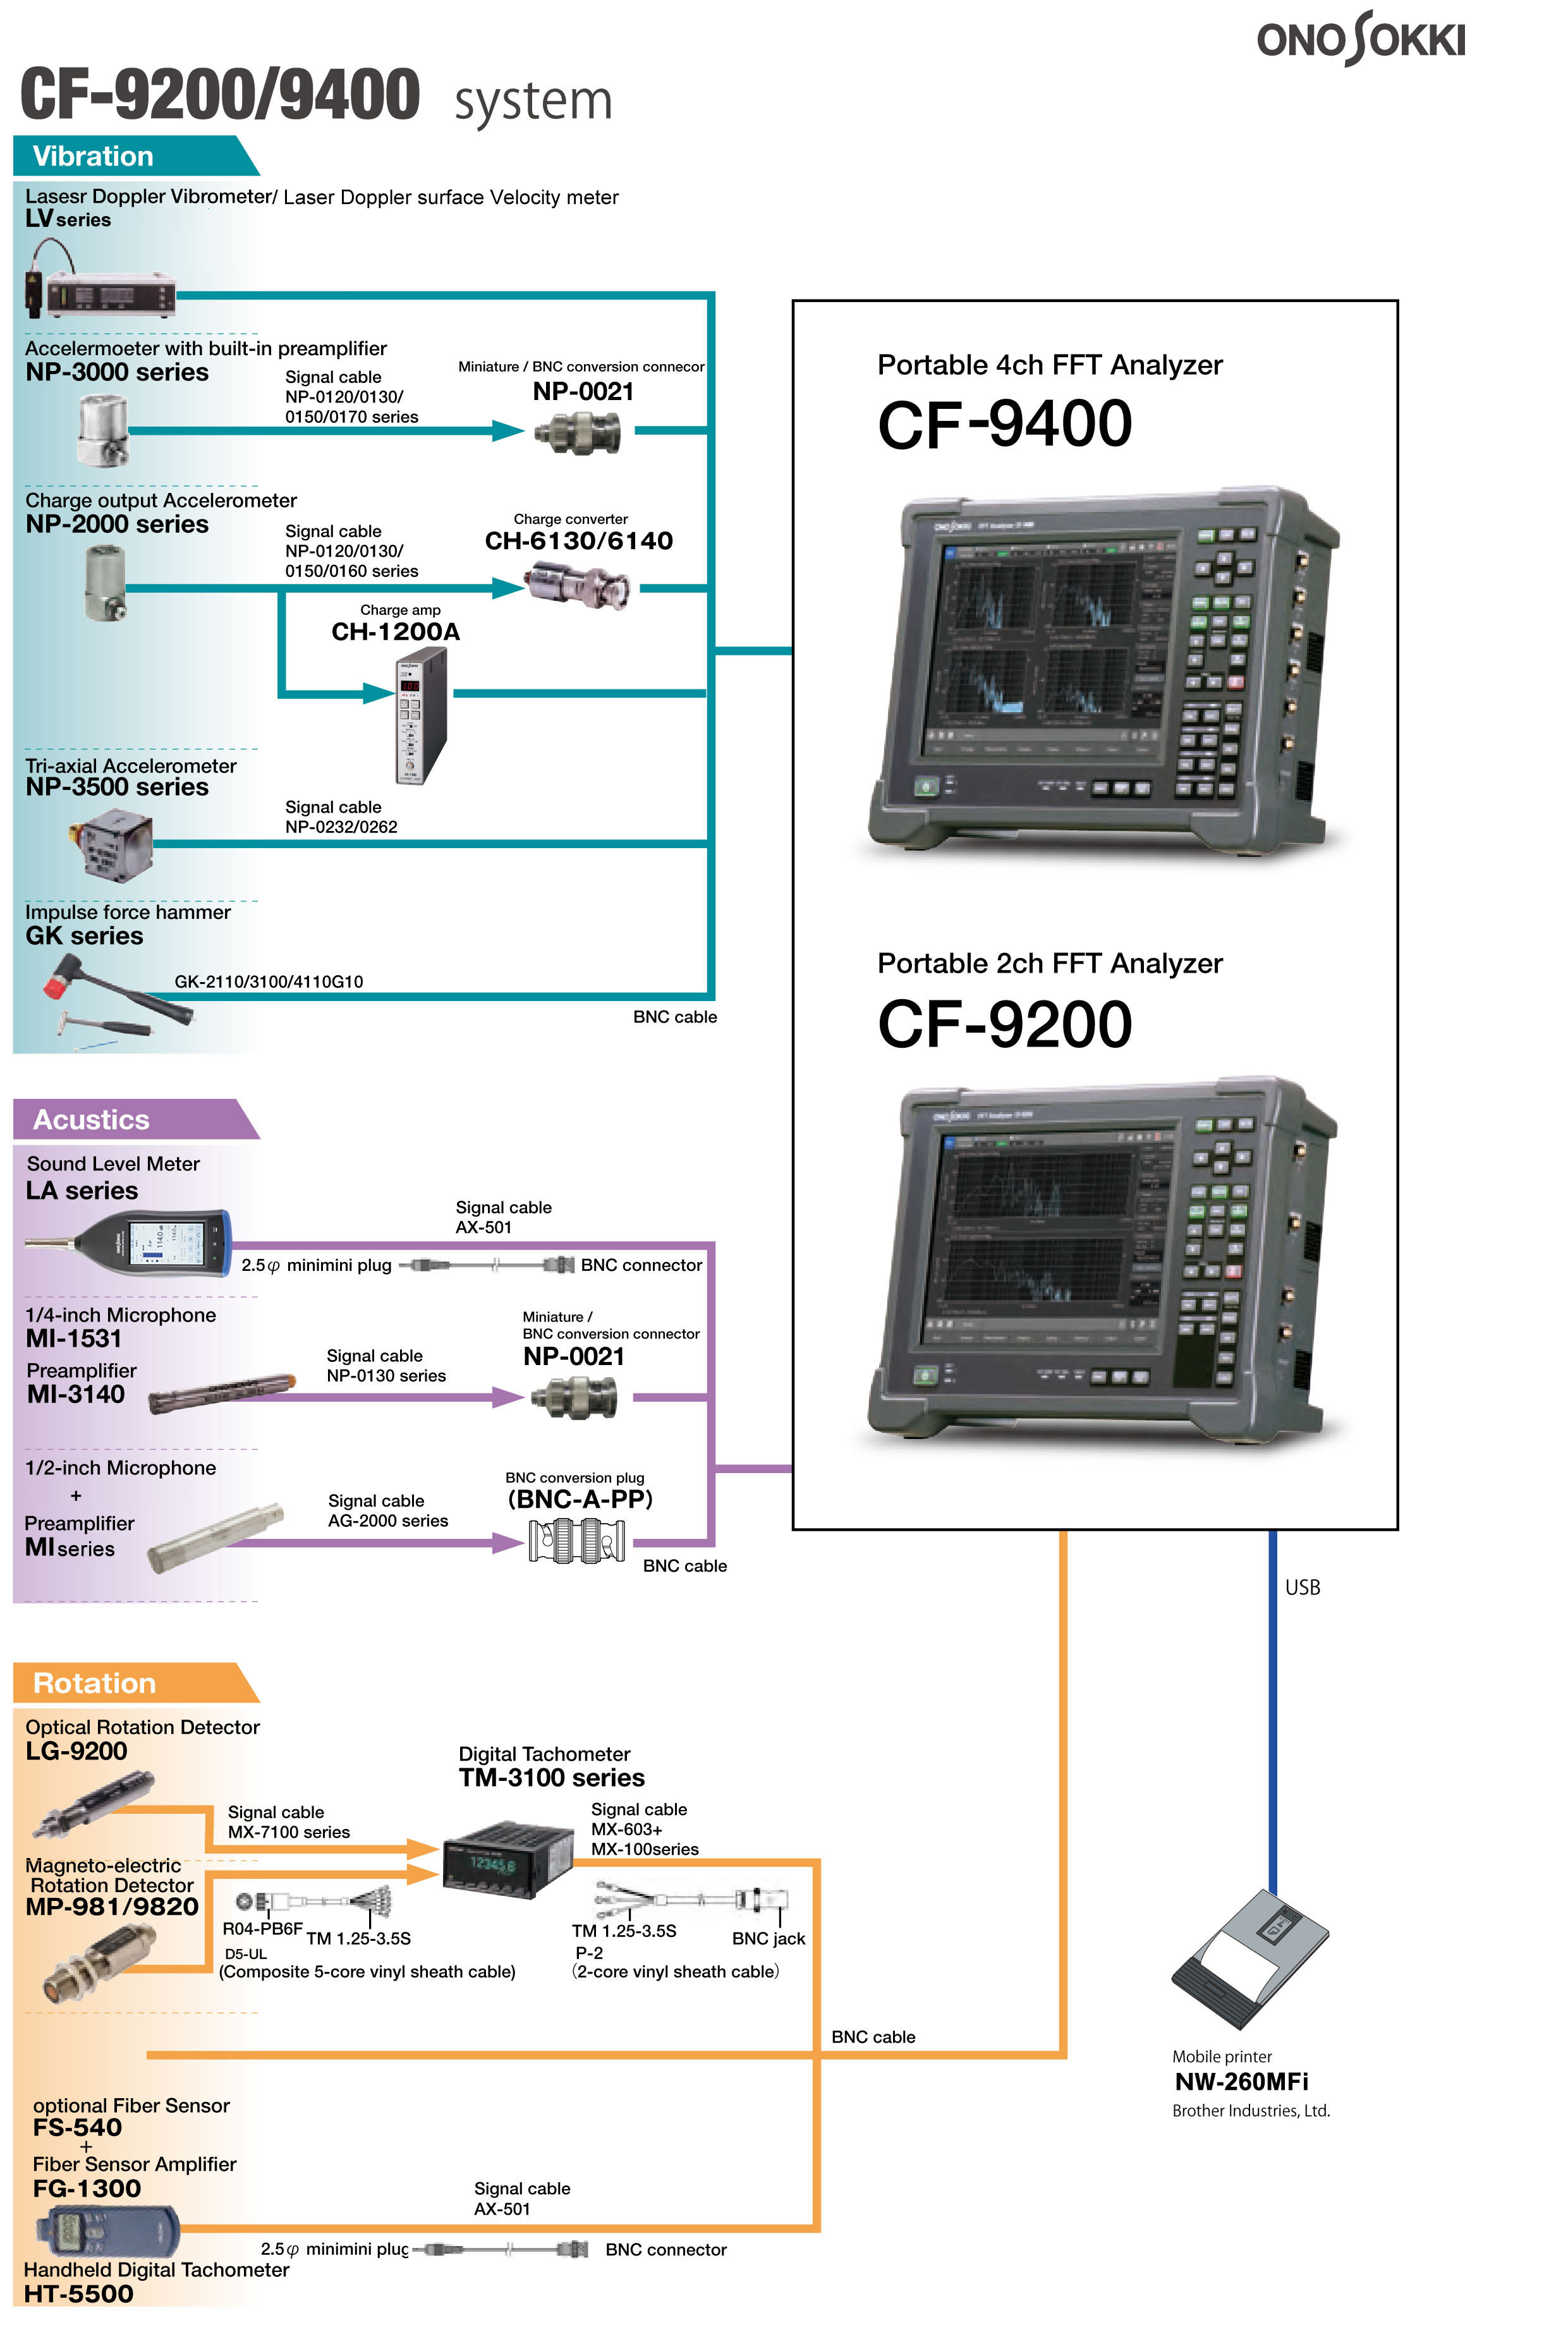
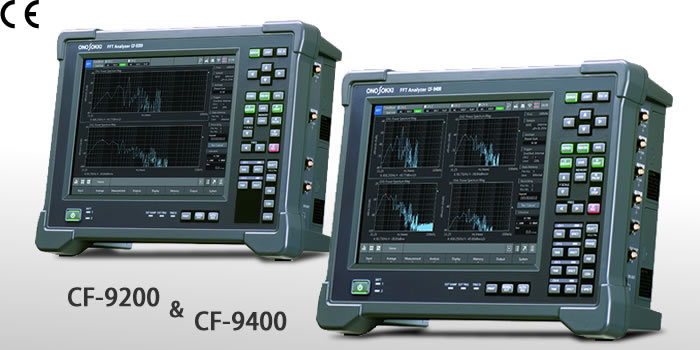
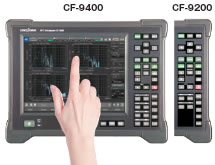
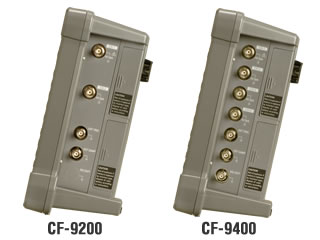
Portable 2 channel/4 channel FFT Analyzer
CF-9200/9400
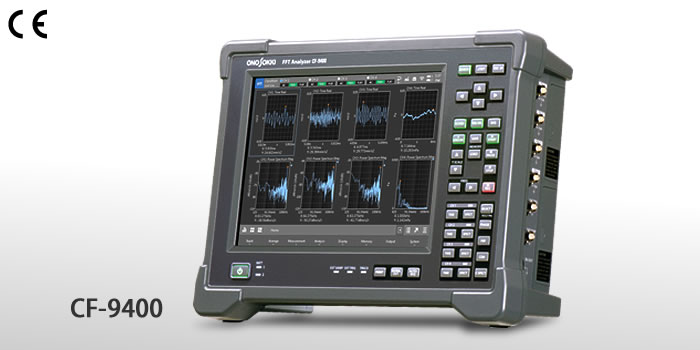
The CF-9200 and CF-9400 are an all-in-one portable FFT analyzer. All FFT analysis operations can be performed with the integrated hard keys and capacitance type touch panel without requiring an external PC for analysis. The new, exclusively developed 100kHz high-performance analysis front-end system incorporating a 24-bit A/D converter enables easier and more reliable analysis of noise and vibration generated by plant lines, pumps, motors, automobiles, railway vehicles, home electrical appliances and devices, and electrical and electronic parts than previous models. The CF-9200 and CF-9400 also offer solutions for field workers in their FFT analysis, including the resonance and frequency characteristics of mechanical structures in a vibrating environment with electromagnetic vibrators and impulse hammers.
![]()
![]()
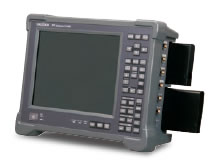
With the CF-9000 series, the two on-board, large-capacity lithium ion secondary batteries enable continuous cordless operation of up to 5 hours*1. The hot-swap function allows the batteries to be replaced while the unit is powered on, enabling the analysis or recording operation to continue while eliminating the need for resetting. The unit can also be recharged while in operation*2, helping to reduce the number of peripherals that would otherwise be needed.
*1When CF-9400 4ch CCLD ON.
*2Full recharge takes 8 to 9 hours with the power on and
4.5 to 5 hours with the power off.
![]()
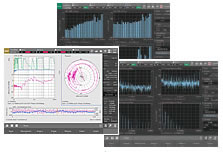
The unit is compact but versatile, capable of carrying out a range of operations from FFT analysis, real-time octave analysis (RTA)*1 and rotation tracking analysis*2, to linear/log sweep analysis using signal output and electromagnetic vibrator control*3. The unit can also perform simultaneous analysis and recording operations, allowing offline analysis back in the office using the CF-9000 main unit and software applications.
*1 Octave analysis software (CF-0923) is required.
*2 Tracking analysis software (CF-0922) is required.
*3 Log sweep/excitation control software (CF-0942) is required.
![]()
![]()
![]() (* Vibration Criterion Curves)
(* Vibration Criterion Curves)
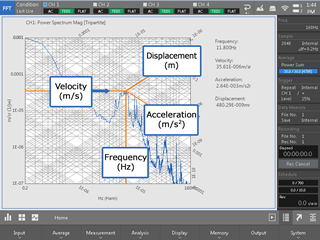
The
CF-9200/9400 comes with a new real-time tripartite graph display
function. (Note)
During FFT analysis, three amplitude
values (acceleration (m/s2)/velocity (m/s)/displacement (m)) for an arbitrary frequency can be read out in real time. This function
will eliminate the need to convert the amplitude by carrying out
differentiation and integration individually by the frequency analysis
function as with the previous models, thus enabling data at that
amplitude to be read speedily.
Displaying VC curves after 1/3 octave processing helps to judge the allowable vibration reference or setting environment evaluation of precision instrument which is sensitive for vibration such as AFM, electronic microscope and laser interferometer.
*1 Amplitude of acceleration (m/s2) and displacement (m) based on the velocity (m/s) on the frequency axis (Hz) can be read by Tripatite graph (image).
*2 VC Curves are proposed as the allowable minute vibration reference of when precision instrument is set. The evaluation by 1/3 octave band width is used in VC Curves. The standard is divided into five stages in increments of 6dB (VC-A, VC-B, VC-C, VC-D, and VC-E) depending on the purpose of use such as optical microscope and laser instrument with long optical path.

![]()

By each input channel with CCLD, an accelerometer with built-in preamplifier, charge convertor for charge output type accelerometer or a microphone can be connected directly to the CF-9200/9400. And using TEDS sensor enables power supply and unit calibration to sensor automatically.
*CCLD(Constant Current Line Drive)means the sensor interface using Constant Current Supply. CCLD from an accelerometer with built-in preamplifier or a microphone preamplifier enables direct connection to an FFT Analyzer without using external amplifier. 2 to 4 mA of CCLD is commonly used.
*TEDS(Transducer Electronic Data Sheet)is a general term for the method which contains information relevant to the sensor. It is defined in the IEEE 1451 series. As information of the sensor is automatically read to the TEDS available measurement devices or amplifiers, the user is ready to take measurements. It can avoid setting error and also saves you time and effort of troubling calibration and measurement preparation.


Automatically detects cable disconnection or connector trouble of an accelerometer and a microphone*, preventing trouble before measurement. With the CF-9000 series, this function can be made disable.
*Built-in preamplifier CCLD type


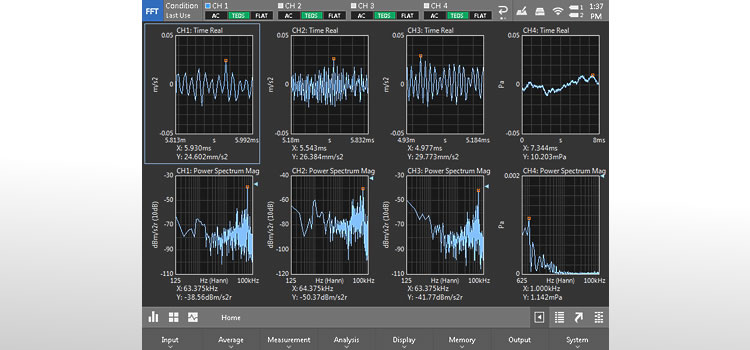
The power spectrum in FFT analysis shows the magnitudes of frequency components of a sampled time-axis waveform, in the form of a graph indicating the power for each frequency band (frequency resolution Δf) on the horizontal axis.
The power spectrum analysis enables detection of abnormal conditions of a facility, which are difficult to estimate through measurement of vibration and noise level and observation of raw time axis waveform. The natural frequency of a structure can also be measured.

In a mechanical system or an electrical circuit, the input-to-output ratio is shown in gain and phase characteristics with the X axis representing frequency.
The gain characteristics indicate how the amplitude of input signals changes as they pass through the transfer system being evaluated. The ratio of the output amplitude to the input amplitude is plotted on the Y axis in decibels.
The phase characteristics indicate phase advance/delay between the input and output signals with the Y axis plotted in degrees or radians.

For rotating machines such as engines and motors that have a wide range of operating speed, resonance caused by the natural frequencies of the machine parts and specific operating speeds can be a serious problem.
The tracking analysis software (CF-0922) clearly presents in visual form which speeds of the rotating machine have increased noise and vibration and which parts of the machine are contributing to the problem.

The highest note of an octave has twice the frequency of the octave’s lowest note. As the frequencies of sound increase in geometric progression, the octave analysis software (CF-0923) is an effective tool for noise analysis.
By using 1/1 and 1/3 octave bandpass filters, it is capable of obtaining the sound pressure level of each band of the audible frequency range of the noise being measured.

The Log sweep function is used to evaluate the resonance points of a transfer system by continuously changing the frequency of the driving sine waves from a 1ch signal output module (CF-0971). By sine-sweeping the X axis with a LOG scale, it is possible to obtain the gain and phase for each single frequency and an accurate response function with a high S/N ratio. The vibration control function limits the amplitude of an electromagnetic vibrator to a desired range, enabling vibration testing without having to consider the frequency characteristics of the vibrator.
MEMORY
SSD(Built-in the CF-9200/9400)
The SSD (Solid State Drive) incorporated in the main unit of the CF-9000 Series can simultaneously run FFT analysis and record time series waveforms that have been converted into digital data by the 24-bit A/D converter. It is also possible to run FFT analysis of recorded data while offline. The results of analyses can be saved in the memory area.
SD/SDHC memory card
By using the SD/SDHC memory card, it is capable of storing up to 32 GB of FFT and recorded (ORF) data.
USB memory
The CF-9000 series are compatible with USB memory sticks. FFT data can be saved in a USB memory stick. FFT and recorded data saved in the SSD bult-in the main unit can also be transferred out via the USB facility.
*Not all types of USB memory operation are guaranteed.
INTERFACE
USB mass storage class function
FFT and recorded (ORF) data saved in the SSD built-in the CF-9200/9400 can be accessed from a Windows PC*. Data extraction and graphing using dedicated software can be easily done. Data stored in a CF unit can be easily transferred to and saved in a PC.
*Condition of connecting PC :Windows® 7(32-bit, 64-bit), Windows® 10(32-bit, 64-bit)
LAN connecting function (partially option)
By connecting the CF-9200/9400 to a Windows® PC using a LAN cable, you can copy and write various measurement data, operate from a PC using the remote desktop function* 1 , and project the screen of CF-9200/9400 with a projector. In addition, by using the LAN external control function (option, CF-0947), the CF-9200/9400 can be controlled.
*Condition of connecting PC :Windows® 7(32-bit, 64-bit), Windows® 10(32-bit, 64-bit)
Wireless LAN connecting function (option)
By attaching a wireless LAN adapter*1 to the main unit of the CF-9000 Series, FFT and recorded data saved in the main unit can be transferred wirelessly to a Windows® PC. The remote desktop function*2 allows to display the CF-9000 Series unit's various screens or operate the unit remotely on a Windows® PC or other portable information terminals.
*1: Please use the recommended products by Ono Sokki.
*2 :Using Microsoft® "Remote Desktop."
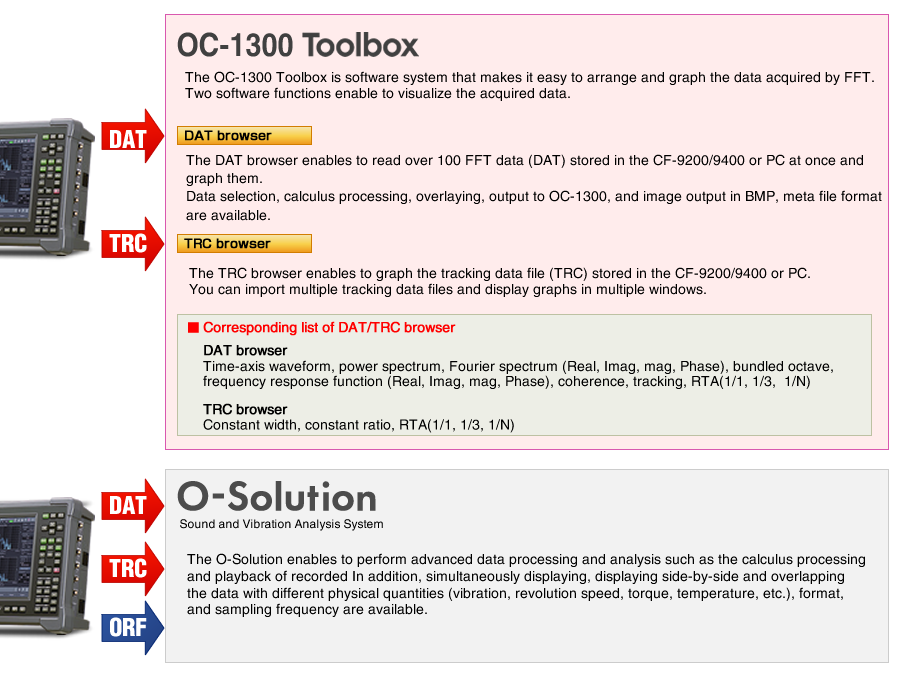
CF-9200/9400 x O series (software)
The O-series software is software series that allow you to import data recorded and saved on the CF-9200/9400 and smoothly arrange, process, analyze, and graph the data.
1. Input section
| Input channels (CF-9200) | 2ch | ||||||||||||||||||||||||
|---|---|---|---|---|---|---|---|---|---|---|---|---|---|---|---|---|---|---|---|---|---|---|---|---|---|
| Input channels (CF-9400) | 4ch | ||||||||||||||||||||||||
| Input configuration | Single-ended | ||||||||||||||||||||||||
| Isolation | Isolated between each channel (permanently) | ||||||||||||||||||||||||
| Input connector | BNC (CO2 type) | ||||||||||||||||||||||||
| Input coupling | DC or AC(0.5 Hz -3 dB±10 %) | ||||||||||||||||||||||||
| Input impedance | 1 MΩ ± 0.5 %, 100 pF or less | ||||||||||||||||||||||||
| Power supply for sensor (CCLD) | Supplies the current to a constant-current type sensor via a coaxial cable from the input connector (BNC terminal): +24V/4mA | ||||||||||||||||||||||||
| Cable disconnection detecting function | Detects cable disconnection when CCLD used. | ||||||||||||||||||||||||
| TEDS function(* Note) | Accepts IEEE1451.4 ver.1.0 based sensor,microphone | ||||||||||||||||||||||||
| Absolute maximum input voltage | AC 70 Vrms 1 minutes(50 Hz) | ||||||||||||||||||||||||
| Input voltage range | 1 Vrms/31.62 Vrms (2 ranges) | ||||||||||||||||||||||||
| DC offset | -60 dB F.S or less(when Auto zero ON) | ||||||||||||||||||||||||
| Input level monitor | OVER: Red LED ON ( range F.S) | ||||||||||||||||||||||||
| Frequency range | DC to 100 kHz | ||||||||||||||||||||||||
| A/D converter | 24 bits ⊿Σ Type | ||||||||||||||||||||||||
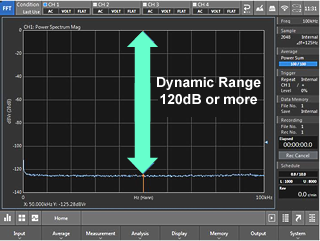
| Dynamic range | 120 dB or more (at 4096 points or more of FFT frame length, 1 kHz or more) | ||||||||||||||||||||||||
| Amplitude flatness | Under 20kHz
: ±0.1 dB 20 kHz or more: ±0.2 dB |
||||||||||||||||||||||||
| Harmonic distortion | Under 20kHz
: -80 dB 20 kHz or more: -75 dB |
||||||||||||||||||||||||
| Aliasing | -80 dB or less | ||||||||||||||||||||||||
| Full scale accuracy | ±0.1 dB(at 1 kHz) | ||||||||||||||||||||||||
| Amplitude linearity | ±0.015 %(at full scale) | ||||||||||||||||||||||||
| Channel to channel cross talk | -100 dB or less(at 1 kHz) | ||||||||||||||||||||||||
| Channel to channel gain accuracy | 20 kHz or
less:±0.05 dB 20 kHz or more (at same range):±0.1 dB |
||||||||||||||||||||||||
| Channel to channel phase accuracy | Under 20
kHz:±0.3 deg 20 kH or more:±0.7 deg |
||||||||||||||||||||||||
| Anti alias filter | 4th Butterworth: LPF 450 kHz -3 dB | ||||||||||||||||||||||||
| Digital filter |
|
||||||||||||||||||||||||
| External sampling input |
|
||||||||||||||||||||||||
| External trigger input |
|
* Note: If a TEDS supported sensor made by other companies is used, TEDS information may not be read depending on the type of a TEDS tip included in a sensor.
1. If you are considering the purchase of a TEDS sensor made by other companies, please consult to the manufacturer or dealer of the TEDS sensor, and perform the operation check.
2. When you want to use a TEDS sensor you already have with the TEDS supported measurement instruments made by Ono Sokki, please perform the operation check with a demonstration product of Ono Sokki. (Please consult your nearest distributor or Ono Sokki sales office nearby.)
2. Display unit
| Size | 10.4-inch |
|---|---|
| Resolution | 800 × 600 dots * |
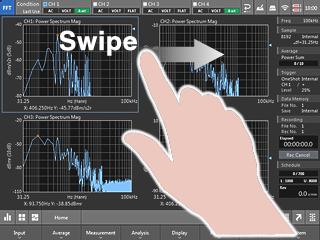
| Method | TFT color LCD with a capacitance type touch panel |
| Brightness adjustment | 2-level brightness adjustment |
| Back light | LED |
* The TFT color LCD is created by the full use of advanced technology. However, the pixels (dots) of non-lighting or always lighting are occasionally existed in the display. (The ratio of the number of effective dots: 99.999 % or more.) Also, unevenness of the color or brightness may be visible depending on the viewing angle or the temperature change. Please note that return or exchange of the product cannot be accepted as the above is not a product failure.
3. Operating section
| Power switch | Power ON:
Press and hold the switch more than 1 second Power OFF: Press and hold the switch until a beep is made. After the beep, lift the finger off to the power OFF. When the switch is pressed continuously, the power is forcibly OFF. |
||||||||||||||||||
|---|---|---|---|---|---|---|---|---|---|---|---|---|---|---|---|---|---|---|---|
| Operation keys (soft keys) | Detailed settings for each function can be performed by soft keys lower on the LCD display. | ||||||||||||||||||
| Operation keys (direct keys) |
|
4. Analysis section
| Frequency range | 100 mHz to 100 kHz | ||||||||||||||||
|---|---|---|---|---|---|---|---|---|---|---|---|---|---|---|---|---|---|
| Frequency accuracy | ±0.005 %(±50 ppm)of the reading values | ||||||||||||||||
| Overlap processing | MAX/66.7 % / 50 % / 0 % / Arbitrary setup | ||||||||||||||||
| Sampling frequency | Analysis range x 2.56 (Internal sampling) | ||||||||||||||||
| Number of sampling points / analysis points |
|
||||||||||||||||
| Overlap processing | MAX/66.7%/50%/0%/ optional setup | ||||||||||||||||
| Window function | Rectangular/hanning/flat-top/force/exponential/user-defined | ||||||||||||||||
| Delay function | With reference to channel 1, time frame of other channels can be delayed by 0 to 8191 points. | ||||||||||||||||
| Time waveform processing function | First and second order differentials/single and double integrals Absolute value conversion/DC cancel/trend elimination/smoothing |
||||||||||||||||
| FFT real-time rate | 100 kHz/4ch (internal sampling: FFT frame length 2048 points or less) | ||||||||||||||||
| Averaging function |
A/D-over cancel / Double hammer cancel / Averaging permission select function (ADD+1) / Averaging undo function |
||||||||||||||||
| Trigger function | Green LED (TRIG'D) blinks when triggered
|
||||||||||||||||
| FFT calculation | 32-bit floating point (IEEE single-precision format) | ||||||||||||||||
5. Processing functions
| Time domain | Time-axis waveform / auto-correlation function / cross-correlation function/impulse response/cepstrum |
|---|---|
| Amplitude domain | Amplitude probability density function/amplitude probability distribution function |
| Frequency domain | Power spectrum/Tripatite graph*/Fourier spectrum/Liftered spectrum/Cross spectrum/Frequency response function/Coherence function/Coherence output power |
| Calculation function (Time-axis statistical processing) |
Mean value / absolute mean value/rms value / standard deviation / maximum value / minimum value / crest factors / kewness / kurtosis |
*1/3oct VC Curves: Display is selectable from VC-A to VC-E. 1/3oct: Bundled octave processing
6. Memory function
| Recording device | Selectable internal storage in main body or SD/SDHC card | ||||||||||||
|---|---|---|---|---|---|---|---|---|---|---|---|---|---|
| Recording function |
|
||||||||||||
| Data file | 9990 (999 data x 10 bocks) data |
||||||||||||
| File format | Analysis data can be recorded simultaneously in 3 different formats (TXT/BMP can be selected) DAT/TXT/BMP (List data can be saved when saving in TXT) |
||||||||||||
| Panel condition memory | Memorizes and recalls measurement conditions. (50 types max.) |
||||||||||||
| Handwritten memo memory | Hand written memo on the touch panel can be memorized. |
7. Interface
| USB |
|
|||||||
|---|---|---|---|---|---|---|---|---|
| DATA |
|
|||||||
| SD card |
|
|||||||
| LAN |
|
|||||||
| Wireless LAN connection |
|
|||||||
| Printer output | Print by PRINT key of the main unit
|
8. Other functions
| Condition view | List display of specified conditions |
|---|---|
| Clock | Year, month and date in western calendar Hour, minute and second display |
| Operation sound/alarm sound | Can be specified ON / OFF |
9. General specification
| Power supply | AC adapter or batteries (Both provided as standard) | ||||||
|---|---|---|---|---|---|---|---|
| Power consumption |
|
||||||
| Operating temperature range | 0 to +40 °C (Humidity 20 to 80 %RH, with no condensation) | ||||||
| Storage temperature range | -10 to +50 °C (Including lithium ion secondary batteries) (Humidity 20 to 80 %RH, with no condensation) |
||||||
| Functional ground terminal | Ground terminal for denoising | ||||||
| Outer dimensions | Smaller than 333(W)×248(H)×112(D) mm *Not including handle, stand and protruded sections. |
||||||
| Main unit cooling | Naturally air-cooling (fanless) | ||||||
| Weight | Without batteries: approx. 3.9 kg | ||||||
| With two batteries: approx. 4.9 kg | |||||||
| CE marking | Applicable(EN61010-1: 2010(3rd), EN61326-1: 2013, EN IEC 63000: 2018) | ||||||
| Vibration resistance | 9.8 m/s2 ( frequency 10 to 150 Hz, 150 minutes, in each of X, Y and Z direction) | ||||||
| Shock resistance | 500 m/s2 (11 ms duration) |
10. AC adapter (PS-P20023)
| Input voltage | AC 100 to 240 V |
|---|---|
| Input frequency | 50/60 Hz |
| Output voltage | Rated 16 V |
| Output current | Rated 4 A |
| Safety standard | PSE / CE / UL / GS |
11. Batteries
| Battery | Lithium ion secondary batteries, "Hot swap" available | ||||||
|---|---|---|---|---|---|---|---|
| Quantity | Two batteries can be mounted on the main unit. (Detachable) | ||||||
| Battery life | Continuous operating of 5 hours(When new two batteries are
mounted.) 4CH 100 kHz analysis / signal output OFF / Liquid crystal backlight(light) / when USB port is not used. |
||||||
| Battery status display |
|
||||||
| When remaining battery becomes less than 15 %, displays a warning message. | |||||||
| Processing on lower battery remaining level | When remaining battery becomes less than 3 %, displays a warning message and shuts down automatically after saving the data in backup. | ||||||
| Stores the latest panel condition | |||||||
| Charging time |
|
12. Signal output (CF-0971 1CH Signal output module): Option
| Number of channels | 1 | ||||||||||
|---|---|---|---|---|---|---|---|---|---|---|---|
| Output connector | BNC(C02 type) | ||||||||||
| Isolation | Non-isolated | ||||||||||
| Output voltage amplitude | ±1 mV to ±10 V(Amplitude+DC offset) | ||||||||||
| Output format | Unbalanced output | ||||||||||
| Output coupling | DC | ||||||||||
| Protection circuit | Short-circuit protection | ||||||||||
| Output impedance | 0 Ω or 50 Ω±10 % | ||||||||||
| Maximum output current | 10 mA | ||||||||||
| Offset voltage | ±10 V | ||||||||||
| D/A convertor | 16-bit | ||||||||||
| Conversion rate | 512 kHz max. | ||||||||||
| D/A convertor | 16-bit | ||||||||||
| Output waveform | Sine wave / Swept-sine / Pseudo random / Random/Impulse | ||||||||||
| THD and spurious | -75 dB or less(at Sine wave 1 kHz, amplitude ±1 V output) | ||||||||||
| FFT Analysis length | 256 to 16384 | ||||||||||
| Zoom analysis | Available(relative to zoom analysis range) | ||||||||||
| Voltage amplitude accuracy | ±0.5 dB or less(at 1 kHz, 1 V0-p, 1 MΩ load) | ||||||||||
| Frequency accuracy | ±50 ppm | ||||||||||
| Digital filter |
|
||||||||||
| Pink filter | Analog method -3 dB/oct ± 1.0 dB(prescribed for 20 Hz to 20 kHz) | ||||||||||
| Burst function | Single burst, continuous burst | ||||||||||
| Burst cycle |
|
||||||||||
| Cycle setting unit and Burst interval |
|
||||||||||
| Taper function | The output can be gradually increased or decreased when the
signal is turned ON or OFF. 1 ms to 32 s(1ms-steps) *This function is disabled when the burst function is ON. |
||||||||||
| Spectrum flatness | 20 kHz to 100 kHz:±1.0 dB or less 0 to 20 kHz:±0.2 dB or less |
||||||||||
| Crest factor |
|
13. Option
| Model name | Product name |
|---|---|
| CF-9200 | Portable 2ch FFT Analyzer(Main unit) |
| CF-9400 | Portable 4ch FFT Analyzer(Main unit) |
| CF-0922 | Tracking Analysis Function (Software option) |
| CF-0923 | RTA Function (Software option) |
| CF-0942 | Log Sweep/Excitation Control Function (Software option) *CF-0971 is required. |
| CF-0947 | LAN external control function (optional software) |
| CF-0971 | 1 ch Signal Output Module(Installation fee will be charged separately.) |
| DR202 | Lithium ion secondary battery made by STL(Two pieces are included at the time of purchase.) |
| CF-0703 | USB connection cable(Included at the time of purchase) (1.5 m・TYPE-A, for mini-B USB mass storage class function)(with ferrite core) *USB cable is provided as standard. |
| CF-0951* | Reference guide(Japanese version)(PDF version is included on the attached CD-ROM). |
| CF-0951E* | Reference guide(English version)(PDF version is included on the attached CD-ROM). |
| CC-0025 | Soft carrying case |
| CC-0091 | Hard carrying case |
| PS-P20023 | AC adapter (standard accessory) |
| VM1391-VM1700 | Power cable (2 m)< for PS-P20023 [for Japan] (standard accessory) |
| VM0600-VM0299A | Power cable (2 m)< for PS-P20023 [for North America] |
| VM0307C-VM0308 | Power cable (2 m)< for PS-P20023 [for Europe] |
| VM0769-VM0770 | Power cable (2 m)< for PS-P20023 [for China] |
| PS-P20025A | Battery charger set (AC power cable is required separately.) |
| VM1391-VM1700 | Power cable (2 m) for PS-20025A [for Japan] |
| VM0600-VM0299A | Power cable (2 m) for PS-20025A [for North America] |
| VM0307C-VM0308 | Power cable (2 m) for PS-20025A [for Europe] |
| VM0769-VM0770 | Power cable (2 m) for PS-20025A [for China] |
*Either one of reference guide is attached.
Optional software specification
Log sweep analysis/Excitation control CF-0942
| Measurement mode(FRA mode) | |
|---|---|
| Measurement frequency range | 10 mHz to 100 kHz |
| Frequency resolution (Log sweep) |
10, 20, 40, 50, 80, 100, 120, 160, 200, 250, 300, 320, 400, 500 lines / decade |
| Frequency resolution (Linear sweep) |
100, 200, 400, 500, 800, 1000, 2000, 2500, 4000, 5000 lines / all band of the measurement frequency range |
| Number of averaging | 1, 2, 3, 4, 5, 6, 7, 8, 9, 10, 20, 25, 30, 40, 50, 60, 80, 100, 120, 150, 180, 200 times and optional number of times |
| Frequency range dividing setup mode | Addition times and signal output level can be changed for each measurement frequency range which is divided (into up to 10). |
| Frequency resolution auto adjusting function | Automatically adjusts the decade of each frequency band and resolution to see the frequency characteristics accurately |
| Frequency resolution increase function | Recalculates the specified frequency range with 20 times to the resolution at the measurement. |
| Calculation function | Frequency axis differential and integral calculus function(1-order differentiation, 2-order differentiation, single integral, double integral), four arithmetic operation |
| Display | |
| Display of Frequency response function | Board diagram (vertical axis:frequency/horizontal axis:gain and phase) |
| Nyquist diagram(vertical axis:real number/horizontal axis:imaginary number)Enables Logarithmic scale display of amplitude | |
| Display mode | FRF
mode(triple screen display) 1) FRF(board diagram), COH(enables ON,OFF of display) 2)Any one of Nyquist or SPEC(1,2ch overlay) 3)TIME, instantaneous spectrum(enables overlay display and specifying channel) |
| List mode (single screen display) 1) Measurement condition 2) List of No./frequency/FRF gain/FRF phase/COH/FRF real number /FRF imaginary number/SPEC1/SPEC2/number of summations for all measurement data |
|
| Peak List
mode (double or triple-screen display) List of frequency, gain and phase on the FRF board diagram display using two ways. 1. Peak point of gain(automatic search) 2. Optionally specified point |
|
| Memory mode 1)FRF of current status data 2)List of saved waveforms 3)Overlay display of waveforms selected from 2)(up to 8 screens) |
|
| Calculation
screen(quad screen display) 1)FRF of current status data 2)FRF of saved data 3) * Waveform of four arithmetic operations and differential and integral calculus of 1),2) 4) * Waveform of open and close loop conversion of 1), 2) 5)Nyquist diagram of calculation result of 3), 4 ) *Waveform of calculation result also can be displayed. |
|
| Display function | Phase
unwrap display Search delta function |
Tracking analysis CF-0922
| Tracking analysis type | Phase Amplitude |
|---|---|
| Sampling method | Constant ratio tracking(external sampling):Up to maximum
frequency analysis order Constant width tracking(internal sampling):Frequency range is the same as that of FFT Analysis |
| Number of FFT sampling points | Power spectrum exponential mean Fourier spectrum exponential mean |
| Max. analysis orders | 6.25, 12.5, 25, 50, 100, 200, 400, 800 |
| Max. number of blocks | 1000(100, 200, 400, 800, 1000) |
| Analysis screen display | 6 screens / list display of tracking available |
| Display function | Time axis waveform, frequency analysis (amplitude, phase), order ratio analysis (amplitude, phase), constant ratio tracking analysis (amplitude, phase), constant width tracking analysis (amplitude, phase), fixed frequency tracking analysis(amplitude, phase), time tracking analysis (amplitude, phase), 3D map, Campbell plot |
| Number of display tracking diagrams | 8 lines(excluding MAX ord, O.A) |
| Schedule function | Rotation schedule(with Automatic judging of decreasing rotation
speed) Time schedule(time trend) |
| Upper and lower limitation setting of rotation times | UP(lower limit → upper limit) DOWN(upper limit → lower limit) UP / DOWN(lower limit → upper limit → lower limit) DOWN / UP(upper limit → lower limit → upper limit) |
| Simultaneous recording & analysis function | Available for constant-width tracking |
Real Time Octave analysis (RTA) CF-0923
| Octave type | 1 / 1 octave and
1 / 3 octave (filter:6 th butterworth) JIS C 1514:2002 Class 1, IEC 61260 Ed.1.0 (1995) Class 1ANSI 1ANSI S1.11:2004 Class 1 |
|---|---|
| Time weighting(time constant) | 10 ms, 35 ms, 125 ms(FAST) 630 ms, 1 s(SLOW), 8 s, IMPULSE rising 35 ms / falling 1.5 s JIS C 1509-1:2005 Class 1, IEC 61672-1:2002 Class 1 |
| Analysis frequency range | 0.8 to 20 kHz(1 / 3 octave), 1 to 16 kHz(1 / 1 octave) |
| Calculation function | Instantaneous value, maximum value, maximum value hold, and
minimum value hold for every one second. Power averaging value, power summation value, linear Leq |
| Analysis screen display | Up to 6 screens(data overlay display available) List display or real-time octave display |
| Simultaneous recording & analysis function | Available |
| Option | CF-0922(tracking analysis function) |
LAN external control function CF-0947 (system requirements)
| Client PC (OS) | Windows® 7 SP1 (64 bit/32 bit) Windows® 10 |
|---|---|
| Software | Microsoft® Excel 2007 (Windows® 7 SP1[32bit]) |
| Microsoft® Visual Studio 2012 (VB, C#) | |
| .NET | Microsoft® .NET Framework 3.5.1 and Microsoft® .NET Framework 4 |
| Network cable | LAN cable** category 6 |
| Accessory | ||
|---|---|---|
| AC adapter (cable for AC adapter: 2 m) | x 1 | |
| Battery(DR202 lithium ion secondary battery) | x 2 | |
| Instruction manual(CF-9200/9400 User’s guide book) | x 1 | |
| CD-ROM (Reference guide, utility, etc.) | x 1 | |
| SDHC memory card (4 GB) | x 1 | |
| USB cable (for USB mass storage class) | x 1 | |
Recommended product
| Model name | Product name/manufacturer |
|---|---|
| PMC02A (discontinued) | Battery charger made by RRC power solutions Inc. |
| BSBT4D09BK | Short-range wireless communication module made by Buffalo Inc. |
| LAN-W150NU2A | Wireless LAN module made by Logitec Corp. |
| MW-260MFi (discontinued) | MW-260MFi made by Brother Industries, Ltd. |
Click here for the latest information on recommended USB memory.
Click here for the latest information on recommended SDHC card.
Revised: 2022/04/13