![]()
![]()
![]()
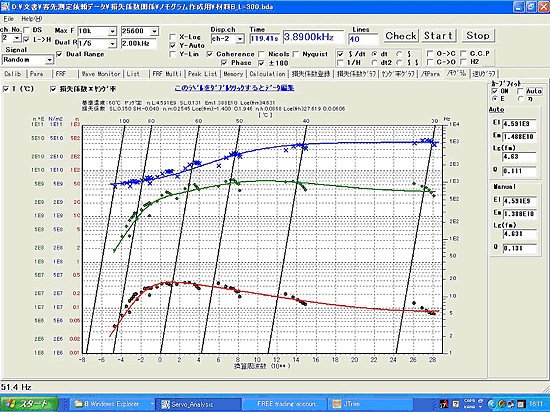
25.Reduced frequency nomogram
The measurement values of the complex elastic modulus at various temperatures and frequencies are organized as a composite curve taking reduced frequency fr at horizontal axis, complex elastic modulus at left-hand vertical axis. By drawing a straight line with the shift factor αT at the representative temperature …T-2, T-1, T0, T1, T2… as the proportional coefficient at right-hand vertical axis in the same figure, the complex elastic modulus and loss factor can be read directly from the composite curve at any temperature [T] and frequency [f]. The figure organized as above is called as reduced frequency nomogram. It is recommended by ISO 10112 as a graph display of the complex elastic modulus of damping materials.
Fig. 4 Example of reduced frequency nomogram |
1.Creating the reduced frequency nomogram
(1) Removal of base materials’ influence:
The loss factor measured by 2 layers of beam attached with damping material on one side is a characteristic of a composite consisting of damping material and base material. The characteristics of a single material needed for nomogram analysis is obtained by removing the influence of the base material by the “RKU basic equation” (refer to calculation of Young’s modulus).
(2) Applying the temperature frequency superposition:
Since the damping characteristics (dynamic characteristics) of the damping material depend on both temperature and frequency, a three dimensional display is required to express the elastic modulus and loss factor for both parameters. Then, the temperature frequency superposition is effective. the The temperature frequency superposition is very useful for viscoelastic materials (especially glass transition state). By replacing the change of temperature with frequency (reduced frequency), the dynamic characteristics of the damping material can be expressed in two dimensions. When taking glass transition temperature Tg as referene temperature T0, WLF equation is set as C1 =17.44、C2 =51.6. WLF equation is well completed for amorphous polymers. While, it is not suitable for crystalline molecule or filler as errors increase and become greater below glass transition temperature.
(3)Master curve:
By applying temperature, frequency reduction rule and combine multiple temperature data into one continuous master curve, the reduced frequency nomogram is completed by plotting the loss factor and Young's modulus of the single damping material on the reduced frequency axis. In order to make this complex property easy to handle, it is also available to fit the viscoelastic property model set in advance and to express the viscoelastic property with several parameters.
2. Procedures of creating nomogram
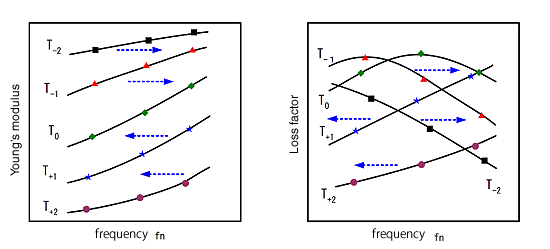
In the certain temperature (T-2~T+2) of the single damping material which is obtained from RKU equation, the relationship between frequency and Young’s modulus in figure 5, the relationship between frequency and loss factor in figure 6 is shown as below.
|
|
Fig. 5 frequency and Young’s modulus |
Fig. 6 frequency and loss factor |
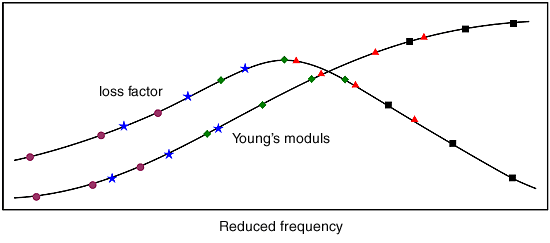
Fig. 7 Reduced frequency and Young’s modulus, loss factor |
Here, the temperature behavior of the viscoelastic material shown in figure5, 6 is considered. The glass transition temperature is estimated appropriately from these figures, and the reference temperature (T0) of the temperature reduced frequency side is set near Tg.
determine a specific temperature T1 (one measuring temperature of a specimen beam).
Calculate αT.
Multiply the resonance frequency of the test specimen measured in the experiment (when the temperature is T1) by αT to calculate the reduced frequency fr .
Taking the reduced frequency on the horizontal axis and the dynamic characteristics of the damping material alone (loss factor, Young's modulus) on the vertical axis, part of Fig. 7 at T1 is obtained.
If this process is repeated for other measurement temperatures, T1, T2, etc., Fig. 7 is completed. If the arrangement of the data in this figure is not smooth, change the reference temperature T0, create FIG. 7 again, and repeat this process until the data plot is arranged smoothly.
Finally, taking the (resonance) frequency on the right vertical axis and the temperature on the upper horizontal axis, the reduced frequency nomogram is completed.3. Notes for creating nomogram
Please take note the followings when creating nomogram.
The target is a two-layered Bernulli-Euler Beam, so do not increase the thickness ratio of the specimen (within 3 times).
Make sure that shear deformation does not occur.
The equation does not take into account the effects of elongation.
Since the loss factor of iron and aluminum is less than 0.001, the loss factor of the base material is assumed to be 0 (zero).
The influence of measurement errors and material errors increase in the calculation process.
When calculating the Young's modulus, the frequency is affected by the square, the thickness is affected by the square, the length is affected by the fourth power.
When obtaining the reduced frequency nomogram, in particular, the measurement data at a high temperature cannot be used in many cases. This is because when the nomogram of the material is obtained, the square root value of the RKU (23.How to calculate Young's modulus, The dual layered composite plate, the upper formula) is very small or negative. Therefore, α
1.1 is provided to ensure the calculation accuracy. Based on this judgement condition, it is necessary to reject the measurement data when creating the nomogram. One of the methods of increasing α (counter measurement), the loss factor of the specimen should be η > 0. 01 as much as possible.
4. How to read the reduced frequency nomogram
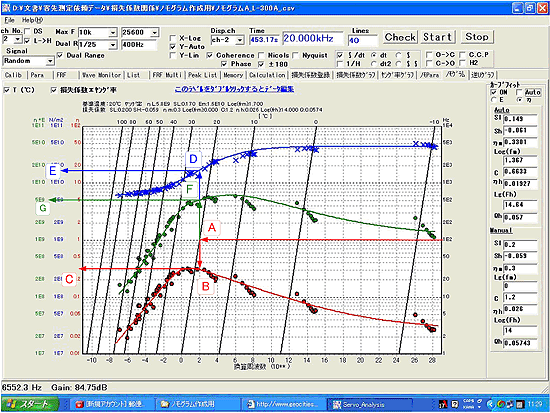
Here’s an example of the reduced frequency nomogram in Figure 8.
Loss factor ( η •), storage modulus (Young’s modulus, E’ ×), loss modulus (E” •) are left hand vertical axis, frequency is right hand vertical axis. The reduced frequency fr is lower horizontal axis, temperature is upper horizontal axis.
Fig. 8 Example of converted frequency nomogram |
Here’s the procedure to obtain loss factor and Young's modulus of the single damping material from
the nomogram in frequency 100 Hz, temperature 20 °C.
draw the line to the left from 100 Hz on the right vertical axis (frequency).
Find the intersection A between this line and the diagonal line from 20 ° C on the upper horizontal axis (temperature).
draw a perpendicular from intersection A to find intersection B with the curve fit line of loss factor, then to the left from B, read the value C at left hand vertical axis as loss factor, about η = 0.3.
draw a perpendicular from intersection A to find intersection D with the curve fit line of Young’s modulus, then to the left from D, read the value E at left hand vertical axis as loss factor, about E’=1.8E10 (N/m2)
draw a perpendicular from intersection A to find intersection F with the curve fit line of loss modulus, then to the left from F, read the value G at left hand vertical axis as loss modulus, about E’’=5.2E8 (N/m2)