26. Inverted “U” plot
When the loss factor measurement data is plotted with the Young's modulus on the horizontal axis and the loss factor on the vertical axis, the data are arranged as if the letter “U” is upside down. This arrangement is the same regardless of the reference temperature T0 . The better the loss factor measurement accuracy, the more the plotted points are arranged on the inverted U-shape. Since the inverse U-shaped curve is drawn based on the curve fit result of Young's modulus, if the curve fit is not efficient, the correlation with the measurement data (plot) becomes worse. The inverted U-shaped plot is useful for verifying the accuracy of the curve fit with Young's modulus and the measurement accuracy of the loss factor and resonance frequency of the specimen.
Fig. 9 The inverted-“U” plot |
27. Approximation of loss factor
As an approximate equation characteristic of loss factor and reduced frequency, the curve fitting is performed in Figure 10. It is obtained as follow.
Equation 13 |
Here’s K:
 |
Equation 14 |
○Loss factor parameters (8 items) |
|
| :Left side slope against the peak of loss factor | |
| :Right side slope against the peak of loss factor | |
| :Common logarithms against the max value of loss factor | |
| :Common logarithms of the reduced frequency with the max value of loss factor | |
| c | :curvature |
| Qh | :Right side curvature of loss factor |
| η h | :Loss factor at the max reduced frequency |
| :Reduced frequency of the right side curvature of loss factor | |
Fig. 10 The approximate equation characteristic Loss factor and reduced frequency |
28. Approximation of Young’s modulus
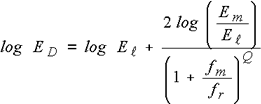
As an approximate equation characteristic of Young’s modulus to reduced frequency, the curve fitting is performed in Figure 11. It is obtained as follow.
 |
Equation 15 |
○Young’s modulus parameters (4 items) |
|
| Q | : inclination at the center of the elastic modulus |
| Em | : center value of the elastic modulus |
| fm | : reduced frequency at the center of the elastic modulus |
| El | : the elastic modulus in the minimum reduced frequency |
Fig.11 Young’s modulus- the approximation of reduced frequency |
In this way, by determining the curve fit parameters of the loss coefficient (8 items) and Young's modulus (4 items), the loss factor and Young's modulus can be expressed by the frequency without the temperature. It is expected to be applied to simulation software such as finite element method.