
![]()
![]()
![]()
Tracking Analysis Software
DS-0322
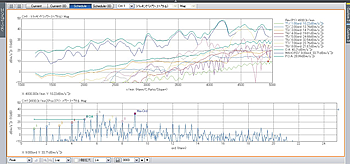
Example of rotation-tracking diagram of engine vibration
This software enables tracking analysis with high-speed (calculation speed: approx. at 20ms/4-ch), high-resolution (1000 blocks max.) and high-accuracy (more than 100dB dynamic range). It can plot rotation-tracking diagram during calculation, and also can set and plot the diagram of intended order or frequency after the calculation. *DS-0321 series FFT analysis software is required.
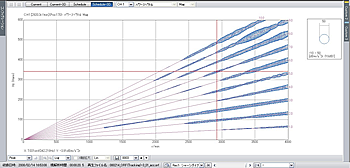
Campbell plot
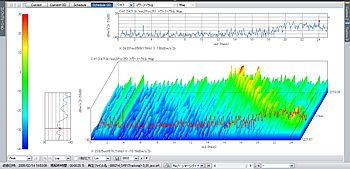
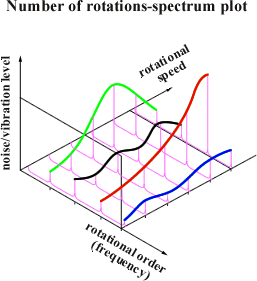
3D array display
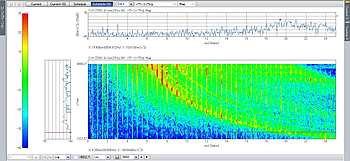
Color map
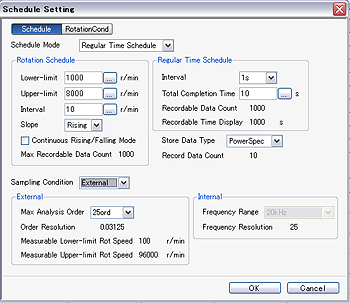
Measurement setting window
What is Tracking analysis
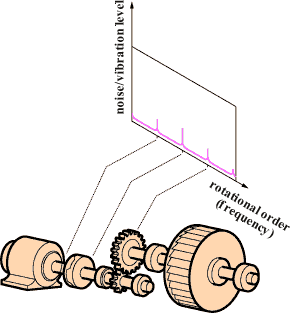
*Rotational order is defined that a based rotational speed is 1-order, n-times rotational component is n-order. Data analysis with order on the X axis and amplitude on the Y axis is called rotational order ratio analysis. Rotational order ratio analysis requires rotational signal information.
Applications for Tracking Analysis
Specification
Number of input pulses |
0.5 to 1024 pulses/1 rotation |
|---|---|
| Input impedance | 100 kΩ |
| Input coupling | DC or AC(0.5 Hz/-3 dB) Voltage fullscale: TTL or ±10 V |
| Slice level | ±100 % within voltage
fullscale Minimum input level: ±0.5 V |
| Slope | +/− selectable |
Analysis section
| Tracking analysis | Memory tracking (real-time plotting is
possible) |
|||||||||||||||||||||||||||
|---|---|---|---|---|---|---|---|---|---|---|---|---|---|---|---|---|---|---|---|---|---|---|---|---|---|---|---|---|
| Maximum analysis orders | 6.25 to 800 orders |
|||||||||||||||||||||||||||
| Number of sampling points | Initial setting value 2048
(maximum at 16384) Order resolution: Initial setting 800 lines(maximum at 6400 lines) |
|||||||||||||||||||||||||||
| Range of rotational speed under measurement (at 1P/R) |
|
|||||||||||||||||||||||||||
| Display function | Time-axis waveform, Frequency
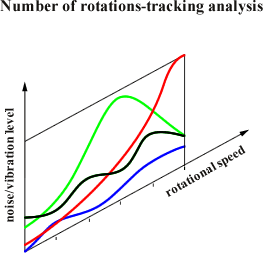
analysis (amplitude, phase), Order-ratio analysis (amplitude, phase), Constant-ratio tracking analysis (amplitude, phase), Constant-width tracking analysis (amplitude, phase), Fixed frequency tracking analysis (amplitude, phase), Time tracking analysis (amplitude, phase), 3D mapping , Campbell plot |
|||||||||||||||||||||||||||
| Processing function | Exponential averaging, Maximum amplitude order tracking, Partial overall tracking, Smoothing processing (2 types), Averaging function of tracking analysis data |
Data input/output function
| Data file | Open/Save at binary or text (.txt) format |
|---|---|
| Tracking data | Open/Save at binary format, save only at text (.txt) format |
| Analysis condition file | Open/Save of arbitrary measurement condition file |
| Copy function of data | Data paste on clipboard at text or bitmap format. |
Operating environment
OS |
Microsoft® Windows® 10 version 21H1 SAC Pro(64-bit) Other editions such as Enterprise, Education, Enterprise 2019 LTSC, etc. need to be discussed individually. |
|---|---|
| NET Framework | .NET Framework 3.5 or later |
*Windows®, Windows Vista® are registered trademarks of Microsoft Corporation in the United States and other countries. Other product names and model names are trademarks or registered trademarks of each individual company. The copy rights are reserved by each individual company.
Revised:2021/10/26