
![]()
![]()
![]()
Sound field visualization using beam forming method -
Real-timing sound source visualization system
There has been a remarkable development in the sound visualization technology of Acoustic fields in recent years. In addition to the existing method such as the contour map by sound pressure level measurement and the vector map using sound intensity, the sound holography method using a multi-channel microphone array and the beam forming method have enabled to perform sound visualization which was difficult so far with high accuracy and speed.
The system introduced here is the sound visualization system using the beam forming method (hereinafter referred to as BF method).
The method of intuitively determining the sound source was mainly used, which was the detailed analysis is performed after recording time waveform at the measurement site to match the camera video and sound pressure distribution. The video display speed is typically 1 fps to 6 fps in real-time processing, especially for transient sound and moving sound source, analysis results cannot be immediately confirmed on site.
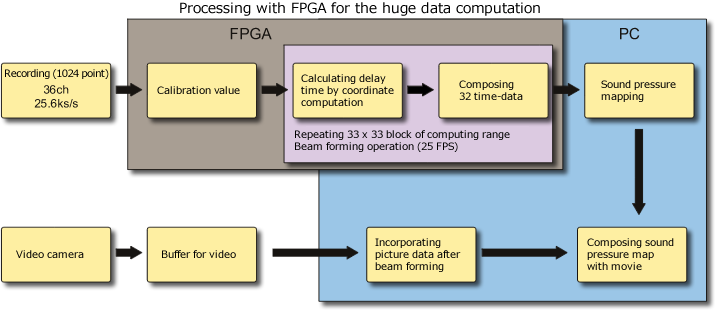
Therefore, we introduce BF method sound visualization system this time, which emphasizes real-time performance, build the system that uses data recorder with built-in FPGA (Field Programmable Gate Array) that handles signal processing and video processing related to the BF method, archives processing speed with 25 fps (40 ms interval).
Features of this system
・Original microphones arrangement achieves wider analysis frequency (500 Hz to 10 kHz).
・Achieve high speed processing (25 times/ sec, spatial resolution: 33 x 33, 1,089 block).
Since it can be superimposed the image of CCD camera on the computer at the measurement site, the generated sound can be analyzed more clearly while watching the video. This system not only improves work efficiency such as shortening measurement and analysis time, but also provides an optimal solution for the problems of sound source visualization.
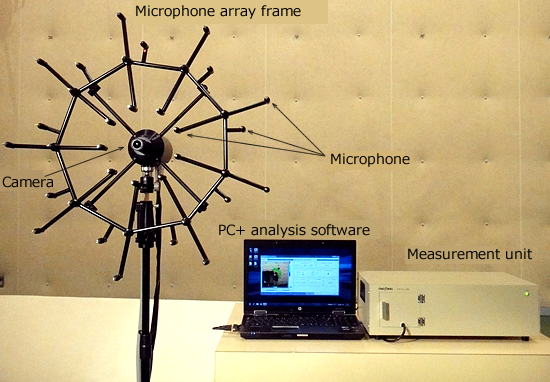
Configuration of microphone array frame
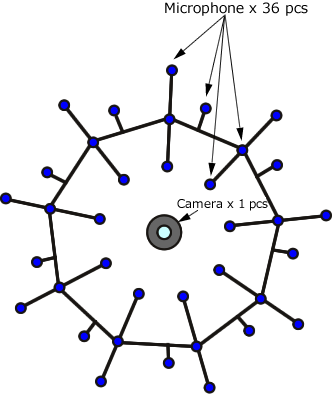
Place the microphones (36 pieces) on the microphone array frame as shown. The circumference is divided into nine, and four microphones are randomly placed. As a result, each microphone interval is random, and it enables to capture sound source from low to high frequency.
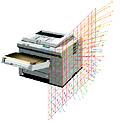
Measurement principle of beam forming method
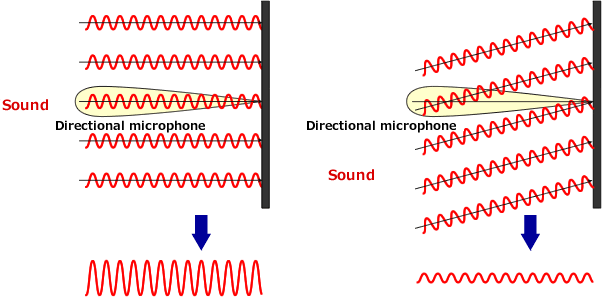
The measurement microphones are non-directional, however, arranging number of measurement microphones in flat (microphone array), and performing delay addition processing for the measurement data become directional microphone as a whole.
We create the sound pressure map by controlling the directivity to control the phase of the measured data.
When sound enters from the front of the microphone array frame, the sound pressure signals at each microphone are almost same phase, then the signals increase to add them together. While, when sound enters obliquely, there is a difference in the time to reach each microphone, then by adding these, the signals decrease to be mutually cancelled.
System block diagram
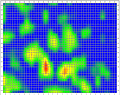
Analysis data example for sound source visualization
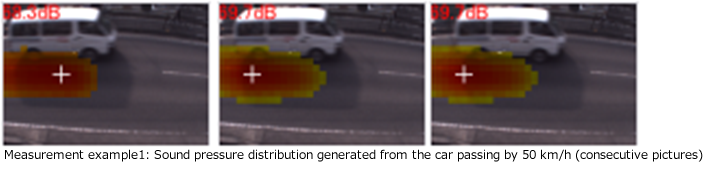
![]() Pictures provided by National Traffic Safety and environment Laboratory
Pictures provided by National Traffic Safety and environment Laboratory
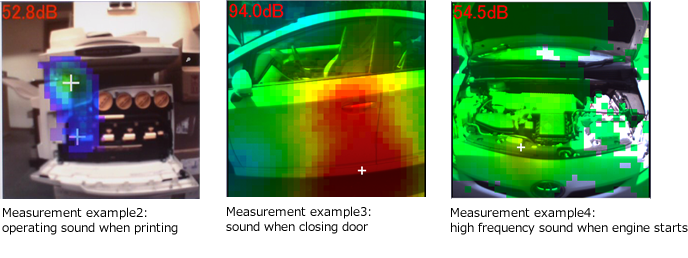
+:the position of the maximum sound pressure, dB displayed in the upper left
*The moving images in the above video are slower than the actual ones. Sounds are muted.
Overview specifications
| Microphone | 1/4 inch microphone x 36 ch | Analysis result | Sound pressure distribution |
|---|---|---|---|
| Measurement specification | Real time analysis frequency band x 1 | Processing speed | 40 ms/ shot |
| Sampling frequency:25.6 kHz | Spatial resolution | 33×33,1089 block | |
| Analysis frequency : 500 Hz to 10 kHz | Saving data | Time waveform, video | |
| Shape, weight | Array diameter:0.8 m,weight:8.5 kg | Re-analysis functions | Replay, frame advance, frame return
Frequency band setting x 1 kind |
Points
There is various sound visualization technology of Acoustic fields. It is necessary to select an optimal method according to the object of measurement and analysis and the purpose. Below is a comparison table for each measurement method for reference.
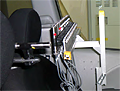
| Beam forming method(BF) | Sound intensity(SI) | Sound pressure map | ||
|---|---|---|---|---|
| Image of device | 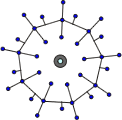 |
 |
||
| Image of analysis result | 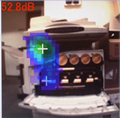 |
 |
 |
|
| Analysis result | Sound pressure distribution | Sound energy direction distribution | Sound pressure distribution | |
| Sound source | Transient sound | ○ | × | × |
| Stationary sound | ○ | ○ | ○ | |
| Operation time | Assembly to measurement | 30 min | 60 min(including setting measurement mesh) | 60 min(including setting measurement mesh) |
| Measurement | 5 min | Depend on measurement point and average time | Depend on measurement points, number of microphones, average time | |
| Result to evaluation | 5 min | 20 min | 20 min | |
| Clean up | 30 min | 15 min | 20 min | |
| System | Measurement band | 500 to 10 kHz | 40 Hz to 5 kHz | Depend on interval of microphones |
| Distance from object | 2 wavelengths or more | no limitation | within waveform | |
| Spatial resolution | 33×33 1089 block |
Depend on the measurement distance, ±5°of positioning accuracy | interval of microphones | |
| Dimension | Diameter of microphone array: 800 mm |
Microphone part
Width:30 to 70 mm Hight:28 to 55 mm Length:200 mm |
Depend on size of array frame | |
| Weight | Microphone array:
8.5 kg |
Probe:0.3 kg | Depend on number of microphones (20 pieces:1 kg) |
|
| System scale | Medium | Small | Large(Depend on measurement area and number of microphones) | |
Revised:2020/02/28