
![]()
![]()
![]()
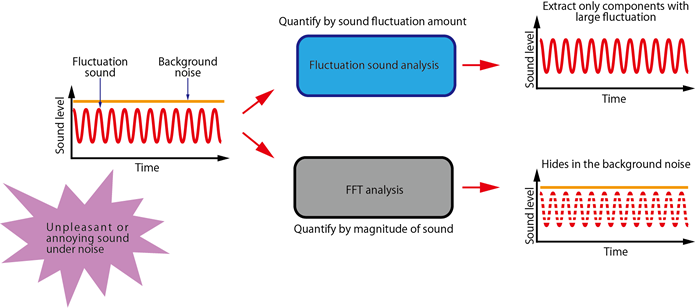
Although the magnitude of the sound is not so large, there are many “unpleasant sound” in the world. For example, “rattling” and “humming“ sounds generated from interior items while driving a car, or abnormal sounds such as “buzzing“ mixed with rotation sound of a small motor, etc. There are several causes for “unpleasant”, but sounds that have significant temporal fluctuation often feel unpleasant even its magnitude (level) is not so large.
The fluctuation sound analysis is the analysis that can extract only the components with large time fluctuation that are not affected by the level. As a result, it becomes possible to quantify the characteristics of various temporal fluctuations that were difficult to detect with conventional FFT, basic roughness or fluctuation strength. In addition, since it can be evaluated with two axes of sound tone (high and low) and time fluctuation cycle for various sound designs (apply effect), deeper analysis than conventional technology is possible.
The unit (DFL) of the sound fluctuation analysis is an abbreviation of Depth of Loudness Fluctuation, which is the depth (differences) of the top and bottom of the time variation of loudness. The graph of analysis results are described in mDFL, so the actual value is multiplying it one thousand times. The (s) after DLF shows linear display and (p) shows log display. (s is the initial letter of loudness unit sone, and p is the initial letter of loudness level of Phon.)
2.Features of fluctuation sound analysis
3. Difference from the standard fluctuation sound analysis indicator
(roughness/ fluctuation strength)
Roughness expressing the roughness of the sound and Fluctuation Strength expressing the fluctuation of the sound, which is the standard fluctuation sound analysis indicator, are parameters that can extract the time fluctuation components of the sound. These parameters limit the fluctuation frequency that can be evaluated respectively. For example, the roughness which evaluates roughness of the sound has a peak at the fluctuation frequency of 70 Hz, and the weighting of the frequency before and after it becomes low. Therefore, if you grasp both parameters as a fluctuation sound in a wide view, there are strong and weak points.
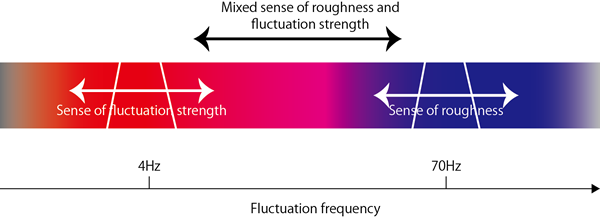
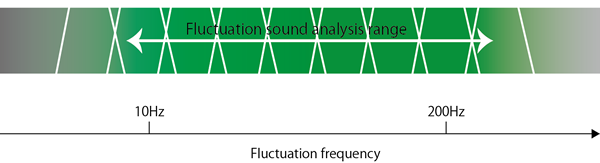
The fluctuation sound analysis is a parameter which can correspond to a wide range of fluctuation frequency.
While roughness and fluctuation strength use one filter of fluctuation frequency to give sensitivity to a specific frequency, the fluctuation sound analysis uses multiple sound filters. (Refer to the above figure.)
Details are described in the next chapter (Fluctuation sound analysis algorithm), but the fluctuation component can extract more finely by passing band limitation filters from low to high band one by one.
4.Fluctuation sound analysis algorithm
We will explain the algorithm of fluctuation sound analysis.
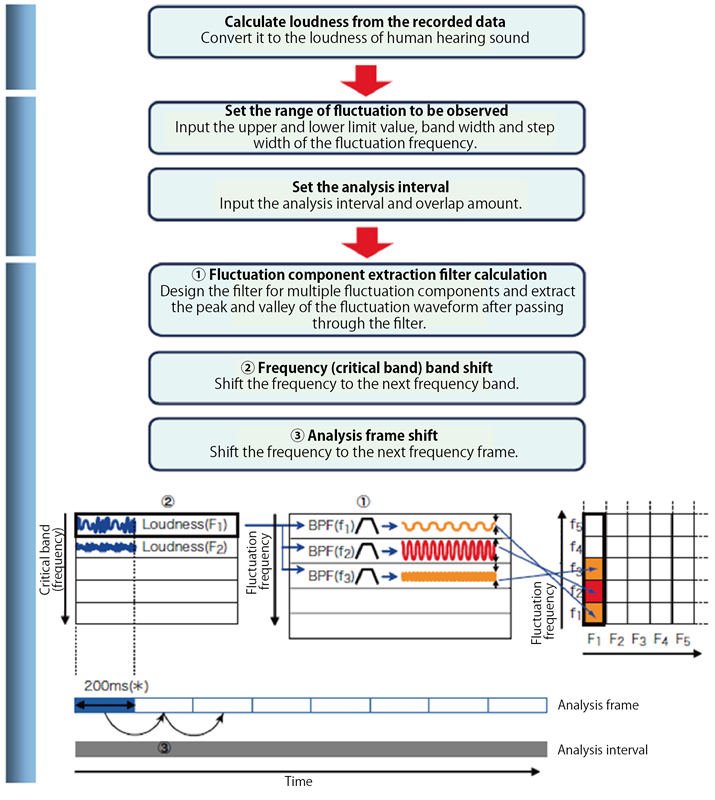
*If the lower limit of fluctuation frequency is 10 Hz or more, the analysis frame length is fixed at 200 ms. If the lower limit of fluctuation frequency is less than 10 Hz, it corresponds to the lower limit value.
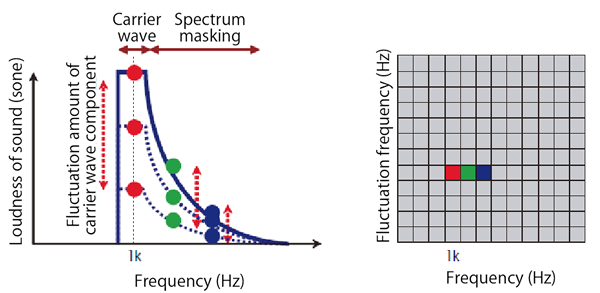
5. Influence of spectrum masking effect
As described in the previous chapter, the fluctuation sound analysis is a parameter focusing on the amount of time fluctuation of loudness (the size of sound considering human hearing). Therefore, the spectrum masking effect at the time of loudness calculation may affect the fluctuation sound analysis.
The following example is an image of the loudness pattern of AM (amplitude modulation) sound. The spectrum masking curve extends upward from the frequency of the carrier wave (1 kHz), and this frequency component also fluctuates over time. Because the fluctuation sound analysis analyzes fluctuation components of carrier wave area and masking area without distinction, it may result that the fluctuation is large against the frequency area affected by masking.
To remove this effect (spectrum masking), it is necessary to calculate the fluctuation sound analysis with the loudness without masking (core loudness).
*The fluctuation sound core analysis is the analysis of the core loudness, and the fluctuation sound mask analysis is the analysis including the spectrum masking effect.
6. Analysis example
The followings are explanation of analysis which taking “Injector operating sound of automobile” and “Abnormal sound of small motor” as an example.
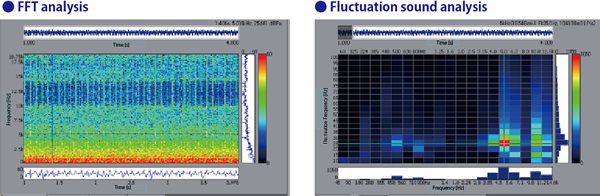
This is an example of evaluating the engine sound of an automobile.
At the time of fuel injection, the needle valve collides with the stopper, causing striking sound. Although the level of the sound itself is not so high, it is very annoying as it is repeated periodically.
The figure on the left is the result of FFT analysis, but the vertical stripes are seen in 5 kHz band. This shows the component of the striking sound. The time interval of vertical stripes (approx. 40 ms) is the variation cycle.
The background noise level in the low-frequency band (800 Hz or less) is large, so it is difficult to extract the time fluctuation component at the level.
The figure on the right is the result of analyzing the same sound with the fluctuation sound. The grid where 5 kHz as the frequency axis (horizontal axis) representing the high and low of the sound tone, and 25 kHz as the fluctuation frequency axis (vertical axis) representing the period of the time fluctuation intersect is darkly displayed. In other words, it indicates that the fluctuation of this component is large.
The background noise component (800 Hz or less) which appeared as a noise component by the FFT analysis does not respond to the fluctuation sound analysis due to steady sound (not fluctuating).
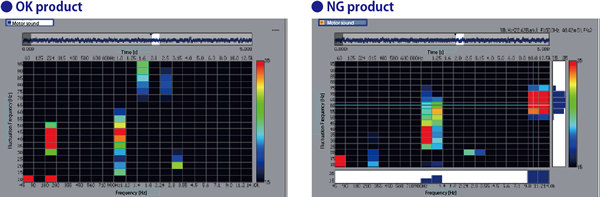
Next is an example of evaluating operation sound of small motor.
Very high-frequency noise may be generated due to motor current abnormality. Detect this sound to judge NG product.
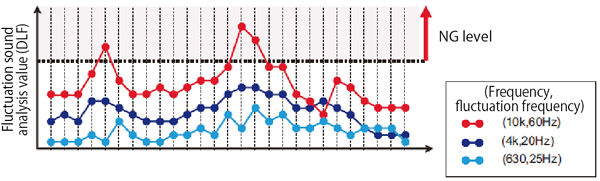
By comparing the OK and NG products as following figure, the fluctuation component of the normal operating sound area (frequency: 1 kHz) can be observed for both products, but only the NG products have large fluctuations in high-frequency components (8 to 10 kHz).
This component is the cause of abnormal noise, and if you observe this band (frequency: 10 kHz, fluctuation frequency: 60 Hz), it is possible to judge OK or NG of the product
*OS-2760 Fluctuation Sound Analyzer:
https://www.onosokki.co.jp/English/hp_e/products/keisoku/data/os2760.htm
*OS-2000 series Time-Series Data Analysis Software:
https://www.onosokki.co.jp/English/hp_e/products/keisoku/data/os2000.htm