![]()
![]()
![]()
What is sound level meter?
8. Structure of Sound level meter
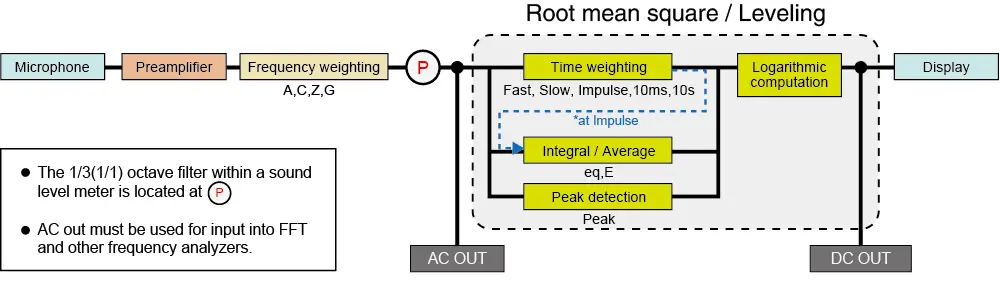
Figure 8-1 shows the block diagram for the electric circuit of a sound level meter. The locations of AC out and DC out are important for understanding and making the best use of a sound level meter.
|
Figure 8-1: Block diagram for a sound level meter |
8-2 Microphone and preamplifier
High-end stereos reproduce the original sound faithfully from small to large volumes and from low to high frequencies. Faithful reproduction requires the original sound to be received accurately. If not, the reproduced sound will not be the same as the original sound. A microphone’s roles are to receive the original sound accurately and convert it into electric signals. These micro signals are then amplified to certain levels and impedance is set properly by a preamp. Sound is defined as waves of air with alternating high and low densities. As sensors for converting inputs into electric signals proportional to the alternating air densities (instantaneous sound pressure), the microphone and preamplifier need to have high sensitivity and good frequency characteristics.
|
Figure 8-2: Capacitor microphone structure Microphones are roughly classified into three types: capacitor type, dynamic type and ceramic type. Capacitor microphones are used for sound level meters because they can be manufactured in acoustically beneficial small-diameter shapes, have a flat profile across a wide frequency range and are more stable than the other types of microphone. Figure 8-2 shows two types of capacitor microphone, namely the bias type and the back electret type. A major difference between the two types is that the bias type applies DC voltage to the vibration membrane while the back electret type uses a rear pole over which permanently electrolyzed polymer film is attached instead of applying voltage. Generally, the bias type is more sensitive than the back electret type. Finally, for microphones designed for sound level meters, self-noise and temperature stability are also important areas to consider. |
8-3 Frequency weighting Z- (or FLAT-), A- and C- weighting
For noise measurement, absolute measurement of sound pressure levels across audible frequency ranges is essential. That said, human auditory sensitivity varies with frequency and it is not possible to explain auditory loudness simply by using root mean square sound pressure values. The equal-loudness-level contours (ISO 226) explained in 6-4 show curves of equal loudness (sound pressure level) across different frequencies. Figure 8-3 shows lines of weighting where the A-weighted line approximates low sound pressure level and the C-weighted line approximates high sound pressure level. In the past, these lines were used for measurement of noise with corresponding levels of loudness. However, subsequent studies found that, while these lines indicate loudness, they are not suitable for representing the annoyance of sound, and that the A-weighted line can be used for high sound pressure levels. Today’s sound level meters are equipped with not only A- and C-weighting facilities, but also a Z-weighting (or FLAT-weighting) feature, which has a flatter profile across frequencies. An A-weighting facility is always used for noise level measurement. For fluctuating noise, which cannot be measured accurately in one measurement, equivalent continuous A-weighted sound pressure level (LAeq), based on average energy over many hours, and percentile sound pressure level (LX), based on cumulative frequency distribution, are used. With a flatter profile across frequencies, C-weighting is used for recording the AC output of sound level meters and measuring impulsive noise (with a wider frequency range). With a flat profile across a wider frequency range than C-weighting, Z-weighting (or FLAT-weighting) can be used as a general-purpose acoustic sensor taking advantage of the AC output feature and the microphone and amplifier with good frequency characteristics.
|
Figure 8-3: Frequency weighting (A, C and Z) |
|
NOTE: Z-weighting and FLAT weighting The "FLAT-weighting" offered on previous sound level meters referred to frequency characteristics with no frequency weighting, or "FLAT" frequency characteristics. Each manufacturer had its own frequency range and other specifications for the feature, with the result that there were effectively no standards on the FLAT-weighting for sound level meters on the market. On the other hand, IEC 61672-1:2002 (JIS C 1509-1:2005) newly sets forth "Z-weighting" and require flatness between 10 Hz and 20 kHz for the feature. With allowable variations and other factors taken into account, however, the FLAT-weighting is practically the same as Z-weighting, as has been treated as such to date. |
8-4 Fast and slow time weighting
Time weighting relates to specifications of the motion of display (including digital reading). Specifically, it corresponds to the time constant for averaging by the root mean square detection circuit shown in Figure 8-4. This dynamic characteristic (time constant) is detailed in IEC 61672-1:2002 (JIS C 1509-1:2005). There are time weighting F (Fast: 125 ms) and time weighting S (Slow: 1 s). Time weighting F is approximate to the ears’ time response. Time weighting S is used to indicate the average level of fluctuating noise. Time weighting F is normally used for measuring noise. As loudness of impulsive noise cannot be measured accurately using Time weighting F, time weighting I (Impulse) (Rise: 35 ms, Fall: 1.5 s) is used for that purpose. In recent studies, however, it has been found that I time weighting is not so suitable for evaluating impulsive sound. Currently, it is not listed in either IEC (JIS) and is only included in IEC 61672-1:2002 Annex C (informative)(JIS C 1509-1:2005 attached document C). Instead, there has been a growing trend towards using peak instantaneous sound pressure as a parameter for evaluating impulsive noise.
|
Figure 8-4: Time weighting and root mean square detection circuit |
Figure 8-5 shows level fluctuations when 1 kHz tone burst signals (200 ms bursts at intervals of 3 s) are input into Fast and Slow time constants.
|
Figure 8-5: Transient characteristics of time weighting (Fast and Slow) (Logarithmic scale on the vertical axis) |
(1) Time weighting F (Fast):Fast values are approximate to the ears’ time response, and the time constant for rise/fall is 125 ms.
(2) Time weighting S (Slow):Slow characteristics are used to indicate the average level of fluctuating noise, and the time constant for rise/fall is 1 s.
Root mean square detection shown in Figure 8-4 is equivalent to having signals of squared instantaneous sound pressure processed by a first-order RC low-pass filter shown in Figure 8-6. The time constants for the Fast and Slow time weighting explained above correspond to the time constant (τ = RC) of the low-pass filter. Figure 8-7 shows response waveforms of rise and fall when, like in Figure 8-5, tone burst signals are input into this equivalent circuit. As shown in the figure, where ei is the root mean square value of a steady input sine wave, time constant τ is as follows:
| Rise: Time corresponding to about 63% of ei |
| Fall: Time corresponding to about 37% of ei |
|
Figure 8-6: Root mean square detection circuit |
|
Figure 8-7: Response waveforms when tone burst signals are input into a first-order low-pass filter (where e is Napier’s constant (base of natural logarithm), e = 2.71828 ...) |
Figure 8-7 is apparently different from Figure 8-5, in which the Y axis is a scale of dB. Using a linear scale instead, the difference between the response waveform of Fast time weighting and that of Slow time weighting is now much clearer
|
Figure 8-8: Transient characteristics of time weighting (Fast and Slow) (with linear scale on the vertical axis) |