![]()
![]()
![]()
What is sound level meter?
8-5-1 AC output
AC out supplies electric signals proportional to the fluctuation of air pressure (i.e. instantaneous sound pressure) received by a microphone. Due to the nature of sound, these electric signals are in the form of alternating current, which reverses its direction at regular intervals and has the same characteristics as 100 VAC (AC voltage, 50/60 Hz) for home electrical appliances. As shown in Figure 8-1, microphone signals are processed by the frequency correction circuit for A-, C- and Z-weighting and are sent out from AC out. AC out signals are used mostly for frequency analysis of sound using analyzers (FFT analyzers, octave analyzers, etc.) or for recording noise levels using level recorders. It must be noted that, while not related to time weighting, AC out signals are affected by frequency weighting.
NOTE: Some sound level meters, such as Ono Sokki’s LA-1400/4400 series, have a feature to supply AC out signals that are not frequency-weighted (Z-weighting) while displaying frequency-weighted sound pressure levels. |
8-5-2 DC output
AC signals are processed by the sound pressure detection/motion characteristics circuit and the logarithmic computation circuit into DC voltage signals in dB that are proportional to dB readout on the sound level meter. In electricity terminology, DC signals are what you will get after putting root mean square values of AC signals (instantaneous sound pressure) through logarithmic conversion to dB.
|
Figure 8-9: Amplitude and root mean square value |
As shown in Figure 8-9, by putting a time waveform (A) with an amplitude of VA through the root mean square detection/motion characteristics circuit, a waveform (B) with a constant height V0 is obtained. V0 is the root mean square of waveform (A) and is suffixed with rms. If (A) is a sine wave, the following equation is true :
By putting the root mean square value V0 rms in (B) through the logarithmic computation circuit, DC out voltage signals proportional to 10 log10 (V0 rms)2 are obtained. If the amplitude (VA) of the waveform (A) is constant, DC out signals will be constant. If the amplitude (VA) of the waveform (A) fluctuates over time, so does DC out signals (affected by time weighting). |
|
Information: AC out and DC out voltages of sound level meters vary from one model to another. This is explained in more detail below: AC out: 0.707 Vrms/full scale If the above nominal values are published, that means:
Sound level meters with a wide linearity range can supply a negative output voltage when the sound being measured is extremely low in loudness. With both DC out and AC out, readings exceeding the linearity range are erroneous and must be handled as such.
AC out signals are fluctuations of sound pressure and have complex waveforms of various frequency components. Noise can be effectively mitigated if its frequency components are clarified. For this reason, AC out signals are used as input into FFT analyzers and real-time (octave) analyzers.
FFT and real-time (octave) analyzers convert signals into sound pressure levels, analyze them for each frequency and display the results as a sound pressure level. AC out signals are instantaneous sound pressure. To record AC out signals as sound pressure levels, a level recorder with a root mean square-level conversion circuit is required. To record data using an ordinary pen recorder, it must be connected to DC out. With FFT analyzers, time constants for obtaining root mean square values correspond approximately to FFT time windows and average time. |
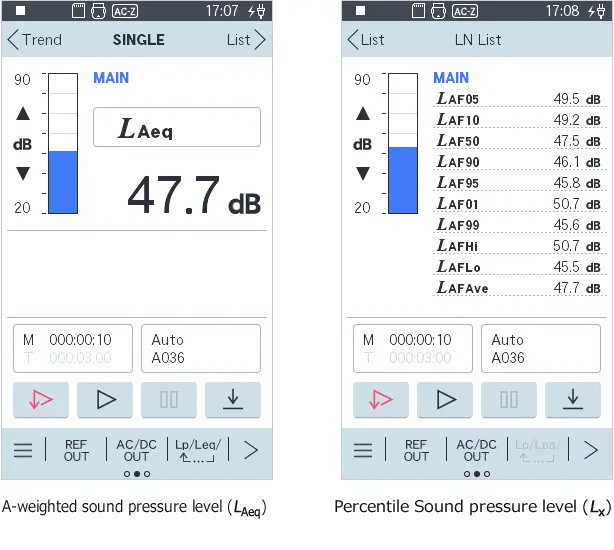
DC out signals are indicated on the display as sound pressure levels based on the measurement range selected on the sound level meter. Displays come in analogue and digital types: analogue displays use a needle to indicate sound pressure levels, whereas digital displays use numerical figures or a combination of numerical figures and bar indicators to show sound pressure levels. Digital displays are becoming more popular than analogue displays. Figure 8-11 shows examples of digital display screens on Ono Sokki’s sound level meters.
|
Figure 8-11: Examples of digital display on Ono Sokki sound level meters |
Figure 8-12 shows simplified graphs of how acoustic signals are converted into digital forms.
Digital figures indicate levels per second. Bar indicators show analogue levels per 100 ms.