![]()
![]()
![]()
What is sound level meter?
11. Octave band analysis (Frequency analysis)
There are two methods for frequency analysis of acoustic vibration: narrow-band analysis (FFT analysis) and octave band analysis.
|
Table 11-1: Frequency analysis methods |
| Analysis band width | Typical application | |
|---|---|---|
| FFT analysis | Constant band width | Troubleshooting and resolution of physical problems |
| Octave band analysis | Constant band ratio | Evaluation of noise and vibration |
Octave band analysis is also called CPB (Constant Percentage Bandwidth) analysis. The following paragraphs explain octave band analysis.
To devise noise reduction measures, the noise needs to be analyzed (frequency analysis). One of the noise analysis methods that have been used for many years is octave band analysis. An octave is a series of notes, with the note at the higher end of the series having twice the frequency of the note at the lower end. (Refer to "What is an octave?" below.)
Frequency characteristic felt by the human ear is a geometrical, making octave band analysis a popular means of analysis. The sound pressure level for each band of the noise being measured is determined across the audio frequency range using a bandpass filter meeting 1/1 octave or 1/3 octave standards. For the characteristics of filters and other relevant details, refer to IEC 61260 (JIS C1514:2002).
|
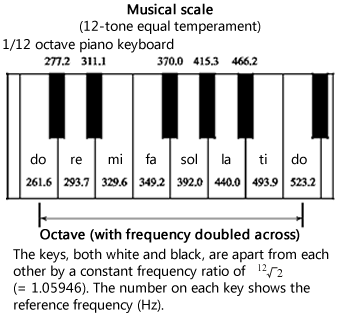
What is an octave? An octave is a series of notes, with the note, e.g. ‘do’, at the higher end of the series having twice the frequency of the note, e.g. ‘do’, at the lower end of the series. An octave band is a one-octave range of frequencies straddling across a center frequency, which is called the center octave band frequency. A third of an octave band is called a 1/3 octave band. As shown in the figure on the right, in the 12-tone equal temperament, an octave is divided into 12 parts with constant ratios between the frequencies of any two adjoining tones, with each part called a 1/12 octave band. |
|
11-2 JIS standards on octave filters
The JIS standards for octave filters are as follows.
It is a translation (IDT) of the corresponding IEC standards, specifies filter characteristics, covering a wide range of filters including not just octave and 1/3 octave filters but 1/N octave filters with required accuracy tolerances of two classes (Class 1 and Class 2). This standard includes not only the filter shape but also requirements for the device (sensitivity to various environments, EMC requirements, etc.). This standard requires an octave frequency ratio that is a power of 10. The standard configuration is similar to that of the JIS C 1509 series sound level meter.
Table 11-2 shows the center frequencies of octave and 1/3 octave filters. These numbers are the nominal center frequencies specified by ISO 266. The exact center frequencies of JIS-compliant filters are determined using calculations specified in JIS C1514:2002 (IEC 61260:1995).
|
Table 11-2: Center frequencies of 1/1 octave and 1/3 octave bandpass filters |
| Center frequency (Hz) | 1/1 octave | 1/3 octave | Center frequency (Hz) | 1/1 octave | 1/3 octave | Center frequency (Hz) | 1/1 octave | 1/3 octave |
|---|---|---|---|---|---|---|---|---|
| 0.8 | ○ | 25 | ○ | 800 | ○ | |||
| 1 | ○ | ○ | 31.5 | ○ | ○ | 1000 | ○ | ○ |
| 1.25 | ○ | 40 | ○ | 1250 | ○ | |||
| 1.6 | ○ | 50 | ○ | 1600 | ○ | |||
| 2 | ○ | ○ | 63 | ○ | ○ | 2000 | ○ | ○ |
| 2.5 | ○ | 80 | ○ | 2500 | ○ | |||
| 3.15 | ○ | 100 | ○ | 3150 | ○ | |||
| 4 | ○ | ○ | 125 | ○ | ○ | 4000 | ○ | ○ |
| 5 | ○ | 160 | ○ | 5000 | ○ | |||
| 6.3 | ○ | 200 | ○ | 6300 | ○ | |||
| 8 | ○ | ○ | 250 | ○ | ○ | 8000 | ○ | ○ |
| 10 | ○ | 315 | ○ | 10000 | ○ | |||
| 12.5 | ○ | 400 | ○ | 12500 | ○ | |||
| 16 | ○ | ○ | 500 | ○ | ○ | 16000 | ○ | ○ |
| 20 | ○ | 630 | ○ | 20000 | ○ |
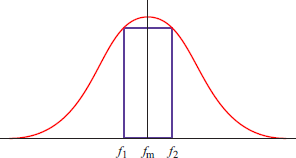
11-3 Octave filter bandwidth and center frequency
1/1 and 1/3 octaves consist of a number of frequency bandwidths. When:
f1 is the lower cutoff frequency,
f2 is the upper cutoff frequency, and
fm is the center frequency,
then the following equations are true for each octave band.
1/1 octave band filter
|
|
(Equation 11-1)
|
|
Figure 11-1: Center frequency, upper and lower cutoff frequencies and bandwidth of 1/1 octave band |
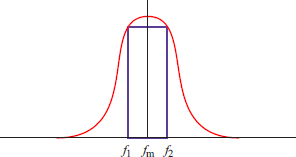
1/3 octave band filter
|
|
(Equation 11-2) 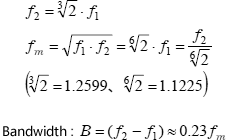
|
|
Figure 11-2: Center frequency, upper and lower cutoff frequencies and bandwidth of 1/3 octave band |
|
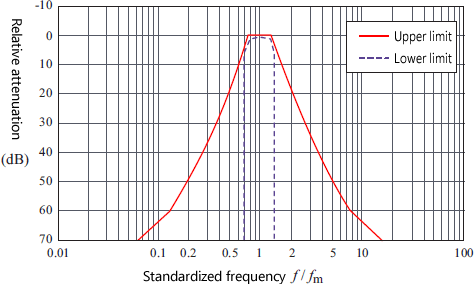
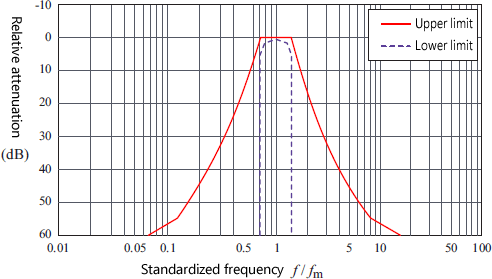
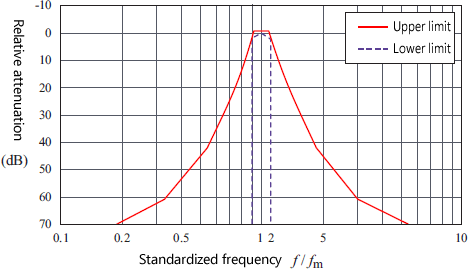
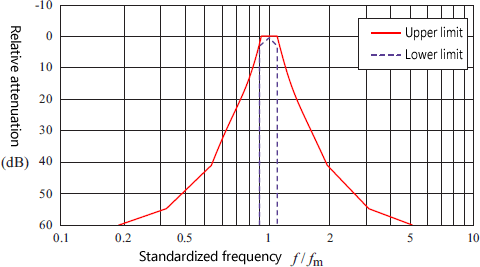
[Supplement]
The following figures show characteristics of 1/1 and 1/3 octave band filters (Source: JIS C1513).
|
Table 11-3: Exact center frequencies of 1/3 octave band in the audible range
IndexX |
Nominal center frequency |
Exact center frequency |
[reference] |
|---|---|---|---|
| -16 | 25 | 25.119 | 24.803 |
| -15 | 31.5 | 31.623 | 31.250 |
| -14 | 40 | 39.811 | 39.373 |
| -13 | 50 | 50.119 | 49.606 |
| -12 | 63 | 63.096 | 62.500 |
| -11 | 80 | 79.433 | 78.745 |
| -10 | 100 | 100.00 | 99.213 |
| -9 | 125 | 125.89 | 125.00 |
| -8 | 160 | 158.49 | 157.49 |
| -7 | 200 | 199.53 | 198.43 |
| -6 | 250 | 251.19 | 250.00 |
| -5 | 315 | 316.23 | 314.98 |
| -4 | 400 | 398.11 | 396.85 |
| -3 | 500 | 501.19 | 500.00 |
| -2 | 630 | 630.96 | 629.96 |
| -1 | 800 | 794.33 | 793.70 |
| 0 | 1000 | 1,000.0 | 1,000 |
| 1 | 1,250 | 1,258.9 | 1,260 |
| 2 | 1,600 | 1,584.9 | 1,587 |
| 3 | 2,000 | 1,995.3 | 2,000 |
| 4 | 2,500 | 2,511.9 | 2,520 |
| 5 | 3,150 | 3,162.3 | 3,175 |
| 6 | 4,000 | 3,981.1 | 4,000 |
| 7 | 5,000 | 5,011.9 | 5,040 |
| 8 | 6,300 | 6,309.6 | 6,350 |
| 9 | 8,000 | 7,943.3 | 8,000 |
| 10 | 10,000 | 10,000 | 10,079 |
| 11 | 12,500 | 12,589 | 12,699 |
| 12 | 16,000 |
15,849 | 16,000 |
| 13 | 20,000 | 19,953 | 20,159 |
(Note 1) Nominal center frequency: referred from ISO 266
(Note 2) area: Also the nominal center frequency of 1/1 octave band
(Note 3) Filter design based on powers of 2 is not recommended by JIS C 1513-1.
(Note 4) Exact center frequency by power of 2: The result of applying 11.6 to equation 11.3.
|
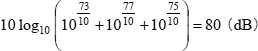
[Refernce] When converting known 1/3 octave data in dB into corresponding 1/1 octave data in dB, add up the 1/3 octave data in dB that corresponds to the target 1/1 octave data. For example, when determining the 1/1 octave band data around the center frequency of 1000 Hz and the corresponding 1/3 octave band has the following data in dB,
the 1/1 octave band data around the center frequency of 1000 Hz can be determined using the following equation.
|