![]()
![]()
![]()
What is sound level meter?
11-4 Calculation of overall level (aggregate band levels)
Frequency analyzers show not just noise (sound pressure) level for each frequency band but also aggregate band levels, or the overall level.
In frequency analysis, frequency weighting such as A-weighting is applied or not applied (FLAT-weighting) depending on the purpose of the analysis. When using FLAT-weighted data to calculate an A-weighted overall level, a combination of measurements for the individual bands and the correction values in Table 11-3 (e.g. 55.2 dB at 200 Hz corrected to 44.3 (55.2 – 10.9) dB) can be used to fulfill the purpose. When noise levels for individual frequency bands are L1, L2, ....... , Ln (dB), the overall level L (dB) can be determined using the following equation. (This calculation corresponds to the sum of dB values in Section 12-1.)
| (Equation 11-8) |
|
This method is often used as part of noise reduction measures to predict reduced noise levels using a table similar to Table 11-3.
|
Table 11-3: A-weighting table |
Center frequency |
Correction value (dB) | Center frequency |
Correction value (dB) | Center frequency |
Correction value (dB) |
|---|---|---|---|---|---|
|
12.5 |
-63.4 |
160 |
-13.4 |
2000 |
+1.2 |
|
16 |
-56.7 |
200 |
-10.9 |
2500 |
+1.3 |
|
20 |
-50.5 |
250 |
-8.6 |
3150 |
+1.2 |
|
25 |
-44.7 |
315 |
-6.6 |
4000 |
+1.0 |
|
31.5 |
-39.4 |
400 |
-4.8 |
5000 |
+0.5 |
|
40 |
-34.6 |
500 |
-3.2 |
6300 |
-0.1 |
|
50 |
-30.2 |
630 |
-1.9 |
8000 |
-1.1 |
|
63 |
-26.2 |
800 |
-0.8 |
10000 |
-2.5 |
|
80 |
-22.5 |
1000 |
0 |
12500 |
-4.3 |
|
100 |
-19.1 |
1250 |
+0.6 |
16000 |
-6.6 |
|
125 |
-16.1 |
1600 |
+1.0 |
20000 |
-9.3 |
Some octave analyzers have the facility to display ALL PASS and OVERALL readings. They have the following meanings.
| NOTE:
In many cases, ALLPASS and OVERALL are used in the same meaning. On the other hand, on Ono Sokki’s frequency analyzers, these terms are distinctly different as described below. |
(1) ALLPASS
The reading of a value obtained by putting AC out (instantaneous sound pressure) signals not through frequency analysis but through conversion into a root mean square value, which is then put through logarithmic conversion into a dB level.
(2) OVERALL
The reading of a value obtained by putting AC out (instantaneous sound pressure) signals through 1/1 and 1/3 octave analyses and, using the 1/1 and 1/3 octave band data, Table 11-3 and Equation 11-8, determining the dB level.
The top graph in Figure 11-7 shows the results of Z (FLAT)-weighted, 1/3 octave analysis of ordinary noise, in which ALLPASS and OVERALL values are nearly the same. The bottom graph in Figure 11-7 shows an A-weighted OVERALL value of the data in the top graph that was calculated using Table 11-3 and Equation 11-8.
|
Figure 11-7: Comparison of ALLPASS and OVERALL values in 1/3 octave band analysis |
NOTE:
While ALLPASS and OVERALL values can be different from each other, they are still effective values. Be careful with this matter. They are almost equal to each other (or are different from each other by only 0.1 to 0.2 dB) when analyzing ordinary steady noise not including transient noise. The frequency band of ALLPASS signals covers the entire range of input signals (e.g. 20 Hz to 20 kHz for microphones) while that of OVERALL signals covers the target frequency band. In a unique case where the noise level is markedly higher at around or above 20 kHz, ALLPASS values can be greater than normal. On the latest sound level meters, the entire process within and after the RMS (root mean square) level circuit (within the dotted line in the block diagram of Figure 8-1) is by digital computation. While this is not shown in the block diagram, when analog signals that have gone through a frequency correction circuit are converted into digital values using the sampling frequency fS (e.g. 64 kHz or 48 kHz) specific to the type of the sound level meter, the maximum frequency band (within 1/2 of the sampling frequency) of the input signals is limited. ALLPASS values include the power value of the maximum frequency band. In a unique case, ALLPASS values of above 20 kHz noise data can vary from one sound level meter model to another.
Ono Sokki’s sound level meters capable of octave analysis do not have the function of computing OVERALL values but have the function of computing two ALLPASS values simultaneously with different frequency- and time-weightings. Figure 11-8 shows an example of two ALLPASS values (ALLPASS1 and ALLPASS2) calculated together.
|
|
|
|||||||||
|
|
||||||||||
|
Figure 11-8: Two ALLPASS (AP) values shown together |
||||||||||
|
[Refernce] In the frequency analysis of the levels of noise from low-noise machinery or background noise levels, it can happen that ALLPASS (or OVERALL) values are in positive dB while band levels are in negative dB. Negative values mean that the power is lower than the reference value (20 µPa) but that the noise power is not negative. For example, adding up the power of the bands using Equation 11-8 produces a value equal to the ALLPASS (or OVERALL) value. Figure 11-9 shows the noise characteristics of Ono Sokki’s microphones. While OA value is about 11 dB, the values for the individual bands are at around or below 0 dB.
|
NC was proposed in 1957 by L. L. Beranek of the U.S. as an evaluation parameter based on the results of a large-scale field survey of office noise and of a questionnaire conducted among people working there as part of a study on steady noise with a wideband spectrum like air conditioner noise. The sound pressure level of the noise being measured is plotted for each octave band to create an NC curve for comparison with a series of reference curves in Figure 11-10. If the created NC curve is below a reference curve for every octave band, the number of that reference curve is the NC number for the noise.
|
Figure 11-10: NC curves |
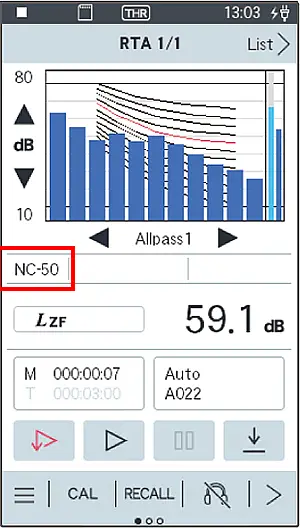
Figure 11-11 shows an example of 1/1 octave analysis values and NC measurements displayed on an Ono Sokki sound level meter. Z (FLAT)-weighting is used as the frequency weighting for such measurements.
|
Figure 11-11: Example of NC number display |