
![]()
![]()
![]()
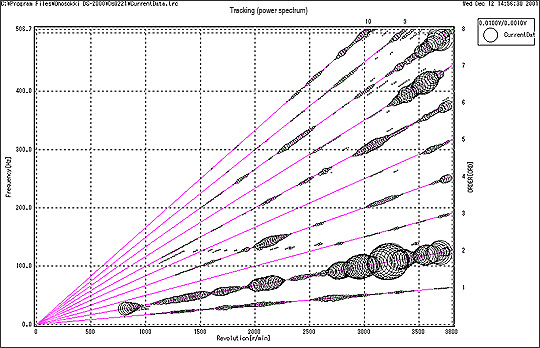
Campbell plot function
DS-0244A
Replaces with DS-0244
In Campbell plot, the vertical axis represents frequency, the horizontal axis represents rpm, and the inclined axis represents rpm order, with the size of circles representing amplitudes. The order, rpm and frequency of large amplitude are recognized at one glance. The DS-0244A can make Campbell plot being based on the result of tracking analysis which has performed by the DS-0222A Series. Saving 3D mapping analyzed by the DS-0222A Sereis enables to open its file and make Campbell plot.
Applications
Applications for Tracking Analysis
Specifications
| Applicable channel | Record
simultaneously 1 ch to arbitrary number of implemented
channels (example: Record 1ch to 4 ch / implements 8 ch) |
|---|---|
| PC environment | Pentium II 400 MHz, 128 MB or more memory / 6 GB or more HDD is required. |
*Windows® XP, Windows Vista® Windows® 7are registered trademarks of Microsoft Corporation in the United States and other countries.
* Pentium ® is registered trademark of Intel Corporation in the United States and other countries.
Revised:2013/11/18