![]()
![]()
![]()
What is sound quality evaluation?
1. Introduction
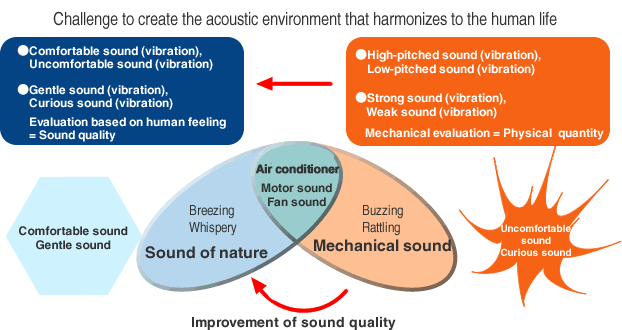
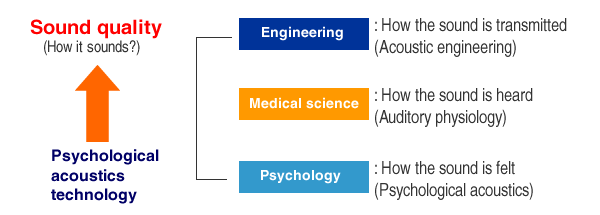
Sound quality evaluation is the technology that analyzes the sound in quantitative way according to the feeling of human by using psychological acoustic technology. In contrast to conventional mechanical evaluation based on physical quantity, this sound quality evaluation technology based on human feeling is thought to add humanity to the future living environment. For example, the current air conditioner has become much quieter than before, but its sound is still mechanical. However, the sound quality is analyzed by using the sound quality evaluation technology, and if the sound improvement technology is advanced, they allow making the sound to rework to a comfortable and soft natural sound. Besides this, the sound quality technology is expected to be applied in various fields in the future, such as sound improvement of vehicles or office machines.
|
|
2. What is phychological acoustics?
Psychological acoustic technology which is the basis of sound quality evaluation is the technology being made full use of various fields such as engineering, medical science, and psychology. And it can be said that it is a further growing technology. For example, there are many parameters of psychological acoustic evaluation, and it is necessary to have a technique to use properly by combining them according to the target sound. In particular, regarding to psychology, the further research subjects are still remained; for example, the human sensitivity results in different depending on preference or social environment. However, these will be solved and be put into practical use in future.
|
|
3. History and popularization of Sound quality evaluation
Sound quality evaluation based on psychological acoustic technology was originally started to be used for evaluation of interior sound of automobiles.
|
|
Loudness, the evaluation quantity of sound loudness, is standardized as ISO. Psychological acoustic evaluation quantity is also gaining attention in other industrial field other than automobile industry. In 1998, the standard for displaying method of noise in home electric appliance industry was established. It is described that not only the noise level but loudness should be displayed. Besides that, even in the office equipment industry etc., Loudness is being paid attention as a quantitative evaluation quantity used for noise countermeasures.
Psychological acoustic technology has been studied from 1930s as shown as the following chronological table. Loudness, one of the psychological acoustic evaluation quantities was standardized in ISO (only steady sound) as discussed earlier, and comes to be used widely.
About this loudness, the studies by various people have accumulated and the present loudness has been made by Zwicker of Germany. Other parameters of psychological acoustic evaluation quantities are devised relatively recently. Many of them were proposed by researchers related to Zwicker or laboratory of Zwicker. Several parameters are currently being studied, and it is technologies that will develop further in the future.
| 1930s | Loudness, Its Definition, Measurement and Calculation (1933) / H. Fletcher, W.A. Munson |
|---|---|
| 1940s | Context effects and the validity of loudness scales (1954) / W.R.Garner The loudness and Loudness Matching of Short Tones (1949) |
| 1950s | Experiments in hearing (1960) / G. Bekesy A re-determination of the equal-loudness relations for pure tones (1956) / D.W. Robinson, R.S. Dadson Calculation and Measurement of the Loudness of Sounds (1951) / L.L. Beranek |
| 1960s | Procedure for Calculating Loudness (1961) / S.S.Stevens |
| 1970s | Procedure for calculating loudness of temporally variable sounds (1977) / E. Zwicker |
| 1980s | Fluctuation Strength of Modulated Tones and Broadband Noise (1983)/ H. Fastl A model for Calculating the Sensory Euphony of Various Sounds (1985)/ W. Aures |
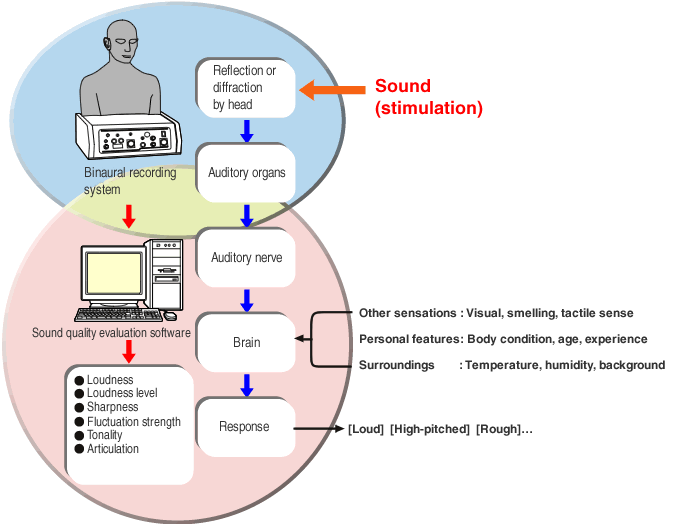
4. Sound perception(auditory sensation)and Sound quality evaluation system
Psychological acoustic evaluation quantity is based on the accumulated efforts by studying human ear structure and operation of auditory nerve, and by the data of auditory tests on a lot of people. Auditory test is performed in the way that actually let them hear the sound, and ask how they feel, and see the response. The response to sound is slightly different depending on age of the person, experience so far, physical condition at that time, surrounding environment such as temperature. Therefore, to derive the psychological acoustic evaluation quantity, tests have been conducted many times on a lot of people, and they have been statistically processed.
|
|
Then why the psychological acoustic technology is necessary?
The sound generated from machines had been evaluated based on physical quantities (sound pressure level, noise level, power level, 1/3 octave spectrum, FFT spectrum etc.) and made countermeasures. However, it is human beings who actually hear the sound. Also the countermeasures against sound, which is generally made by reducing physical quantity, has limitation. It is not impossible to reduce all the sound, as long as very expensive, large, and heavy materials are used to cover the target. But it is not realistic. And reducing sound does not necessarily make comfortable sound environment.
The evaluation quantity called psychological acoustic evaluation quantity quantifies how human beings feel when hearing the sound, rather than only reducing physical quantity such as sound pressure. Because psychological acoustic evaluation quantity is associated with physical quantity, it is easier to obtain clues to know how to improve the sound quality from the sound quality evaluation quantity. This method of feeding back to mechanical design is a method called acoustic design.
|
|
| Psychological acoustics evaluation quantity | Unit | Description |
|---|---|---|
| Loudness | sone | Loudness of sound Stationary sound is standardized in ISO 532B |
| Loudness level | phon | Logarithmic display of Loudness |
| Sharpness | acum | High-pitched sound Felt when the balance between low band and high band is deviated to low band and high band. |
| Roughness | asper | Roughness, rasping, throbbing Felt when Loudness fluctuates with a short cycle. |
| Fluctuation strength | vacil | Opposite of fluctuating feeling, smooth feeling Felt when Loudness fluctuates slowly with a long cycle. |
| Tonality | tu | Feeling of pure tones It indicates how much pure tone component is contained in the sound. |
| AI | % | Articulation of language Evaluation quantity to evaluate the articulation of language |
For more deep understanding of sound quality evaluation, we introduce the actual analysis example below. The following graph shows the example of analysis to 6 mechanical sounds which has different sound volume each.
■Loudness 1-6 kinds of parameter
The upper green line, the result analyzed with the evaluation quantity "A-weighting sound pressure level", shows same values for all 6 sounds. On the other hand, the lower pink line, the result analyzed with "Loudness", shows all 6 sounds have different values.
When hearing these 6 sounds actually, we recognize that each sound has different sound volume, just like the result of Loudness.
As known by this example, sound volume that human beings really hear cannot be evaluated only by the evaluation quantity based on sound pressure including A-weighting sound pressure level.
|
|
■Loudness 2-Passing noise by a motor cycle
The next example is the sound when two bikes are passing through in order.
Same as the previous example, analysis was performed by two parameters, with A-weighting sound pressure level and Loudness.
The upper green line, the result analyzed with the evaluation quantity "A-weighting sound pressure level", shows same values for 2 sounds. On the other hand, the lower pink line, the result analyzed with "Loudness", shows that the value of bike sound passing secondly is larger than first bike.
|
|
■Loudness 3-Mechanical noise
The third example is the analysis result of two mechanical noises.
When hearing actually, the second mechanical noise sounds larger than the first one. But the value of latter is smaller in the analysis result with A-weighting sound pressure level. This example indicates that the result evaluated with A-weighting sound pressure level differs from the actually hearing feeling. Then why does not the value of sound pressure correspond to the sound loudness actually heard?
|
|
5. Concept based on the Loudness calculation
The following three phenomena are phenomena which have influence on how human beings feel loudness of the sound.
|
1. Frequency characteristics of ears
2. Spectrum masking (phenomena occurring on the frequency axis) 3. Temporal masking (phenomena occurring on the time axis) |
These three phenomena should be considered for calculation of Loudness.
5.1 Equal loudness curve(pure tone)
One of the factors that is required for Loudness calculation is frequency characteristics of hearing sense. The graph below shows equal-loudness curve respect to pure tones. You can see it has characteristics that the sensitivity is high in the frequency range from 2 kHz to 4 kHz, and the sensitivity is low in the low-pitched sound.
This characteristic differs depending on the sound pressure. The high sound pressure area of the upper data features relatively is flat, and the low sound pressure area in lower data has the characteristics that the sensitivity is low. Frequency characteristics of human hearing sense are very complicated. In Loudness calculation, such complicated characteristics are taken into consideration. A-weighting curve uses a filter which is similar to the frequency characteristics of hearing sense. However, it uses a filter that corresponds to an equal loudness curve for medium sound pressure 40 phon curve in the drawing, so it may be different from the volume of sound when human beings hear it.
5.2 Spectrum Masking
Influence of spectrum masking is also important factor of Loudness. Masking is phenomena that when let another sound hear during a sound is being heard, the other sound is masked by the first sound and disappeared.
For example, you are hearing the noise of narrow banded frequency at 1 kHz. At this time, the shaded range in the graph above is masked by the noise of narrow banded frequency at 1 kHz. Even if another sound is added to this range, the loudness is not increased. It may not be heard at all because the sound is drowned by the added sound depending on the sound properties.
The curve shape of spectrum masking differs according to frequency and sound pressure. It is non-linearly, complicated phenomenon. The curve by being masked draws the shape like a bandpass filter. The range corresponding to the filter passing bandwidth is called critical band (unit: Bark).
The reason why spectrum masking occurs is in the ear mechanism. The following picture shows the structure of the ear. The sound passes through External Ear to vibrate Eardrum and Ear Ossicle, and reaches Cochlea. The Cochlea is an organ that decomposes the frequency of the sound simply, having a volute-shaped like a snail shell.
The following drawing (shaded part) shows the cross section view of the volute-shaped tube is unwound and straightened.
The inside of the Cochlear is divided into upper and lower parts by a membrane called basal membrane. The vibration reached to the Cochlear while vibrating this membrane, and goes through the Cochlea from entrance to exit, and excites the nerve cell on the basal membrane. The degree and position where basal membrane is strongly vibrated is featured by the frequency of incoming sound. The sound with high frequency vibrates largely at around the entrance, and the sound with low frequency makes large amplitude in the back (exit) of the Cochlear. Thus, if the frequency of the sound differs, the nerve excited is different. That's the way people feel the difference of sound, high-pitched sound and low-pitched sound.
5.3 Spectrum masking and loudness of sound
To more understanding about relationship between spectrum masking and loudness of sound, let us explain by the simplified model of masking curve.
The upper is the graph when two sounds (A and B) of frequency are separated on the frequency axis. The square part represents each sound, and shaded part in pale color represents the part masked. Because the loudness of sound is proportional to those areas, you feel that the loudness of sound has been increased about twice when sound B is added to sound A than when sound A is only existed.
On the other hand, the lower is the graph when frequencies of two sounds are close together. The masked area of two sounds has overlapped part. As a result, the area does not increase so much compared to the case only sound A is existed in spite of being added sound B. And only the loudness of sound increases only a little. By adding sound B to sound A, the sound energy becomes twice in both upper and lower graphs. So comparing the two graphs at the sound pressure level, the two have the same value.
5.4 Loudness calculation chart
In order to calculate the loudness of sound by taking into consideration of these phenomena, the loudness is obtained by using following chart in ISO 532B.
|
A
|
To simulate frequency masking, the model like an upper graph A is used. The frequency masking curve with gently inclined which is toward to higher frequency than the sound itself has much larger influence on surroundings than the frequency curve toward to low frequency. So only the upper curve is taken into consideration.
To obtain Loudness, first performs the 1/3 Octave analysis and then writes down the result on the chart shown. Next, calculate the lower area of the curve drawn, and read the Loudness value corresponding to the area. Select the appropriate chart in ten kinds of chart available in ISO532B and obtain the Loudness.
5.5 Critical band width
In the chart of 5.4, hearing frequency characteristics and spectrum masking described are taken into considered. The hearing frequency resolution is almost equal to the 1/3 octave band width. (It is when discussing about loudness of sound. The resolution of sound pitch is finer.)
However, the width is wider than 1/3 octave band and the resolution becomes coarse in the sound area lower than 500 Hz. In the method of ISO532B, in order to broaden the bandwidth according to the resolution of hearing resolution, adding is performed. That is why in the ISO chart, the interval between vertical lines in the low range becomes narrow and three or four bands are drawn together.
5.6 Temporal masking
Other important factor of Loudness is temporal masking. This is the masking occurred on the time axis.
For example, temporal masking is the phenomena if you make a sound briefly immediately after a certain sound stops, the sound that has been made latter will be drowned out by the previous sound and cannot be heard. This is because that the vibration of membrane in ears when hearing the first sound does not stop suddenly, but gradually decreased. And the excitement of nerve which is close to the membrane is also gradually decreased.
The influence of this temporal masking is not taken into consideration in the Loudness calculation method in ISO. So only the Loudness of steady sound can be evaluated by the method in ISO.
5.7 Sound quality evaluation system of Ono Sokki
The sound quality evaluation system by Ono Sokki calculates Loudness based on ISO532B. However, the sound fluctuating temporary cannot be evaluated by the ISO method. Ono Sokki's system is developed to take into consideration the influence of temporal masking (post masking) in addition to the ISO method. The result is calculated every 2 ms.

5.8 The reference of Loudness
The reference sound of Loudness is a pure tone with 40 dB of sound pressure level and 1 kHz of frequency. At this time, it will be 1 sone. (The Loudness level: 40 phon) The sound that sounds the same size as this sound is 1 sone, and the sound that sound twice the size is 2 sone.
6. Concept of Sharpness calculation
The sharpness is determined by the balance of high pitch sound and low pitch sound. Sharpness is calculated based on the data of Loudness.
| 1. Draw the spectrum of loudness
2. Calculate the gravity center of spectrum area 3. The Sharpness is getting higher as it goes to the left side (high pitch side) on the frequency axis. |
First, calculate the Loudness. Then, draw the spectrum of the calculated Loudness.
|
|
Sound A is low pitch sound, and sound B is high pitch sound. If they are pure tones, you can find which sound is higher and how much difference there is by comparing both frequency values. However, the frequency components exist in wide range, it is not easy to compare. So, Sharpness calculation is used to indicate which tone is higher.
First, calculate the center of gravity of loudness spectrum area (The area under the red curve in the figure). Then, draw down the line from the center of gravity to the lower side, and calculate the distance from original point (0 Hz, 0 Bark) to that point. The longer the distance between them, the higher the sharpness.
|
|
In Sharpness calculation, the length of red arrow on lower of each data is calculated. However, with sharpness calculation alone, it is not enough for human hearing sense. For the correction, weighting factor is used. The loudness (loudness density) for each critical band is weighted in proportion to the critical band rate. And then multiplied by the weighting coefficient as shown below, and calculate the center of gravity of the loudness spectrum.
|
|
6.1 Reference of sharpness
The reference of sharpness is the narrow band noise centering on 1 kHz, and the band width is 1 Bark. At this time, the sharpness will be 1 acun.
7. Concept of Fluctuation strength calculation
Human feels fluctuation of sound when loudness of sound is changed (large sound and small sound repeated), and when frequency is fluctuating (repeated high pitch and low pitch).
It is said that humans feel the strongest sense of fluctuating when the frequency fluctuates at 4 times in one second (modulation frequency: 4 Hz). In the calculation of fluctuation strength, it shows how much fluctuation components are included in time history of loudness. When the loudness is close to modulation frequency 4 Hz, the strength of fluctuation is increased.
If the cycle of this fluctuation is very slow, human feels the fluctuation (feeling of tottering) little, and feels the fluctuation very strong if the fluctuation cycle is relatively fast.
|
|
7.1 Reference of fluctuation strength
The reference sound for fluctuation strength is a sound that is 100% AM modulated from a pure 1kHz with a 4 Hz modulation frequency, and its sound pressure level to be 60 dB. At this time, the fluctuation strength will be 1 vacil.
8. Concept of Roughness calculation
Roughness is also felt when the loudness or frequency of the sound is modulated. However, the sound you feel the roughest is the modulation at higher frequency (Modulation frequency at 70 Hz).
When human feels roughness of the sound, his/her hearing sense is catching the modulation of the sound. But the modulating sounds cannot be heard separately. Since modulating many sounds are heard together as one sound, it is felt as rough sound, not a modulating sound.
|
|
In the calculation of roughness, it shows how much fluctuation contents the time history of the Loudness includes in. The maximum roughness is found to be around a modulating frequency of 70 Hz.
8.1 Reference of roughness
The reference sound for roughness is a sound that is 100% AM modulated from a pure 1kHz with a 70 Hz modulation frequency, and its sound pressure level to be 60 dB. At this time, the roughtness iwll be 1 asper.
9. Fluctuating feeling and rough feeling
Even with the same modulated sound, if the modulation frequency is different, hearing impression you heard differs. Sometimes it may be heard with fluctuation feeling, or sometimes with rough feeling.
|
Modulation frequency 1Hz |
It is possible to distinguish the top and bottom |
|
|
|
|
Modulation frequency 4Hz |
It is possible to distinguish the top and bottom, |
|
|
|
|
Modulation frequency 70Hz |
It is understandable that there are fluctuations, but it is impossible to distinguish the top and bottom
|
|
|
|
|
Modulation frequency 200Hz |
Uncertain that there is variation = Flatten |
|
|
|
The above graphs are sound pressure waveform and loudness in time-axis of the sound that is performed 100% amplitude modulation of 1kHz. When the cycle of the fluctuation is slow (modulation frequency: 1 kHz), the high level and low level can be distinguished.
When the modulation frequency is 4 Hz, high level and low level is able to be distinguished, but the level difference is decreased because of the influence of temporal masking.
At 70 Hz of modulation frequency, the difference between high level and low level is decreased. The fluctuation cannot be clearly distinguished, but it is found that the sound includes fluctuation contents.
At higher modulation frequency at 200 Hz, the time waveform of loudness is flattened. It sounds smoothly in hearing sense, and no rough feeling is felt.
10. Analysis example
10.1 Excavator sound and symphony sound
The following analysis example shows the comparison of excavator sound and symphony (The 4th movement of the 5th Symphony composed by Beethoven). These two sound completely different, but after performing 1/3 octave analysis which is used in sound evaluation, both spectrums are almost the same result.
|
|
There are various evaluation parameters for sound quality. In this example, roughness, the parameter of showing sound roughness, is used to compare and evaluate the two sounds. The graph below shows the spectrum of roughness. The higher the value is, the larger the roughness is. The sound difference between symphony and excavator is clearly found by using this parameter.
|
Symphony sound
Excavator sound |
10.2 Vehicle engine sound before and after the engine warm-up
The following example shows the sound quality evaluation of automobile engine sound. The sound quality of a vehicle engine differs according to the temperature of the engine itself, high or low temperature. The high-pitched sound is distinctly heard before warm-up of the engine, and then that concerned sound is decreasing after warm-up of the engine. When analyzing those sound by using 1/3 octave spectrum which has conventionally been used, you can find that the spectrums before and after warm-up are almost the same as shown below. In other word, this conventional method cannot be used for analysis and evaluation of the difference in sound quality before and after the warm-up.
|
Before warm-up
After warm-up |
The followings are the analysis result using Loudness, which is the most basic sound quality evaluation amount, to express the value proportion to the sound value human have heard. The horizontal axis represents frequency, vertical axis represents Loudness. Both Loudness values shown above have little difference before and after warm-up, it can be said that the loudness of their sounds are almost the same.
|
Before warm-up
After warm-up |
The following data shows the analysis result of sound fluctuations strength that is one of the sound quality evaluation amount. The horizontal axis represents frequency, vertical axis represents fluctuation strength.
|
Before warm-up
After warm-up |
The fluctuation strength is the evaluation value that shows the sound fluctuation strength in the same way as same as human has felt. You can see the big difference between before and after warm-up at the part circled in red in the graph, which frequency is around at 4 kHz. From this result, you can see that the high-pitched and unpleasant sound of an engine before warm-up is caused by component fluctuation at 4 kHz. By using the sound quality evaluation, the various sounds including abnormal sound are able to be analyzed effectively.
The closing remarks
To create more comfortable sound environment, the sound evaluation closer to the evaluation by human does is efficient. Ono Sokki is always ready to support you to design comfortable sound environment.
Reference page
OS-2740 OS-2740 Sound quality evaluation software
https://www.onosokki.co.jp/English/hp_e/products/keisoku/data/os2740.htmOS-2000 series Time-series Data analysis software
https://www.onosokki.co.jp/English/hp_e/products/keisoku/data/os2000.htm