![]()
![]()
![]()


For example, when 94dB CAL signal from the sound level meter is inputted to the DS-0221, the calibration is operated by the unit calibration function to change the power spectrum to 94dB. The large value is displayed in time waveform after the calibration. This value can be displayed in sound pressure (Pa) unit by multiplying 20x10-6 to the time waveform using the calculation function.
The followings are explanation of the unit calibration and calculation method of the DS-0221. These are same in the CF series.
Please read through the explanation by comparing time axis waveform (half amplitude value) and rms value, sound pressure level (dB) and pressure (Pa). (Sound pressure level is the value which displays sound pressure rms value into dB.) Moreover, the subscript "r" is added to the rms value after the unit for a description.
| (Display example) |
| Vr: Voltage rms value | V: Instantaneous voltage (Half amplitude value) |
| Par: Pressure rms value | Pa: Instantaneous voltage (Half amplitude value) |
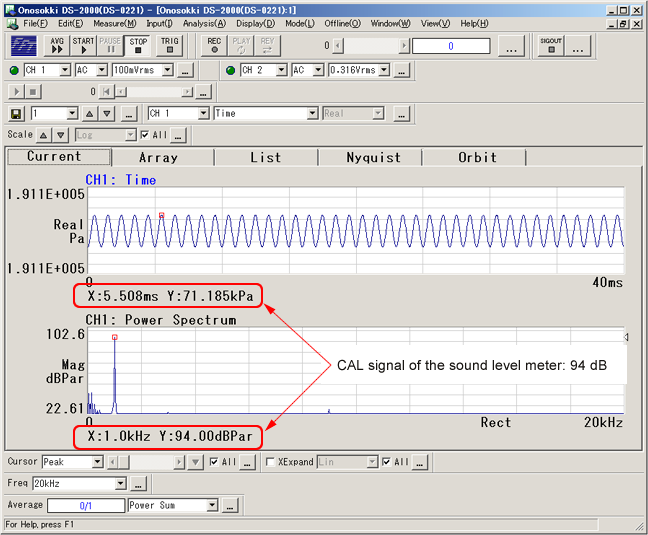
(1) Sound Level Meter CAL signal
If the CAL button is turned ON when the Sound Level Meter is set to 100dB range and flat frequency characteristic, signal of 94dB is outputted from the AC terminal. This output signal waveform is displayed on the figure 1. The value which is displayed on the figure 1 is already calibrated by the DS-0221 unit calibration function, and the value of the time-axis waveform becomes extremely large. However, the power spectrum is 94dB which is same as the sound level meter. The reason for this is described in the following.
Figure 1 |
(2) Sound pressure level (dB) and sound pressure (Pa)
The sound pressure level is defined in the following calculation formula;
![]()
From the formula (1), the sound pressure level for 94 (dBr) is 1 (Par). Please note that the sound pressure level 94 (dBr) and 1 (Par) are determined as rms value in general. The AC out signal of the sound level meter can be considered as "voltage signal being in proportion to the pressure changes". The measurement of absolute pressure cannot be operated. The time waveform of the figure 1 is considered as the waveform which displays instantaneous pressure difference.
(3) Power spectrum
The power spectrum is expressed as the amplitude rms value which is obtained by 2048 sampling points. (Display of the half-amplitude value is possible depending on the setting.)
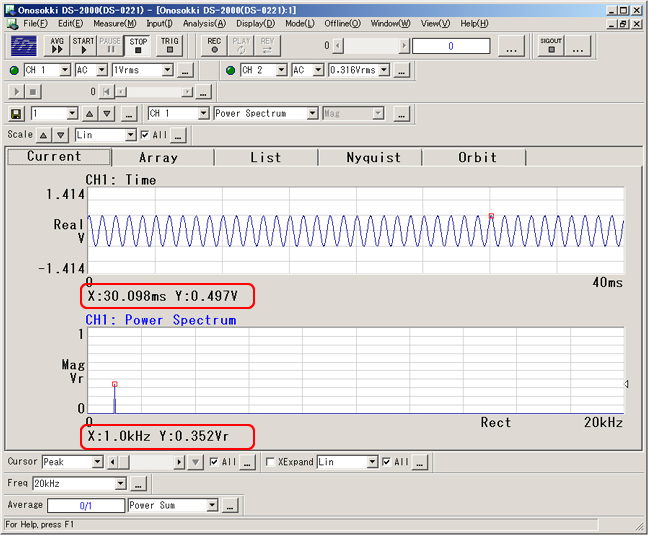
The figure 2 shows the voltage value data which is before the unit calibration. The power spectrum is set as LIN display to enable voltage reading. The rms value of the time waveform can be read by 1 kHz of the power spectrum because the signal is sine wave. However, it is read by overall value in general, and overall value can be read as "0.347Vr" in the figure 2.
The following can be said from the above. In this sound level meter, the relation of sound pressure, pressure change and voltage are as follows; "When the sound pressure level is 94dBr, value changes by pressure change to 1Par and voltage rms value is 0.347Vr".
Figure 2 |
(4) Time-axis waveform and rms value
The amplitude (half-amplitude value) of the time waveform in figure 2 can be read as 0.491 V. The power spectrum is displayed 0.347 Vr as an rms value. In sine waveform, the relation between rms value and half amplitude value is multiple of √2. Cal signal is sine wave, so rms value can be obtained as 0.491÷√2=0.347Vr. You can see that 0.491 V and 0.347 Vr are expressing the same meaning. 1 Par is 1.414 Pa (half amplitude value), so when the amplitude of CAL signal is 0.4907 V, the instantaneous voltage is 1.414 Pa. The coefficient value for converting voltage to sound pressure can be obtained as follows; 1÷0.347=1.414÷0.491=2.88(Pa/V)
(5) DS-0221 Unit calibration
Finds the coefficient to display 94dBr when 0.347Vr by formula (1). It becomes the coefficient k (EU/1) which is converted the voltage rms value A to sound pressure level B (dB). The following formula can be obtained when it is applied to the formula (1).
In the DS-0221 setting, only one fixed value (EU/V) can be set. P0 is also fixed value, so coefficient K can be obtained in the formula of K=k÷P0.
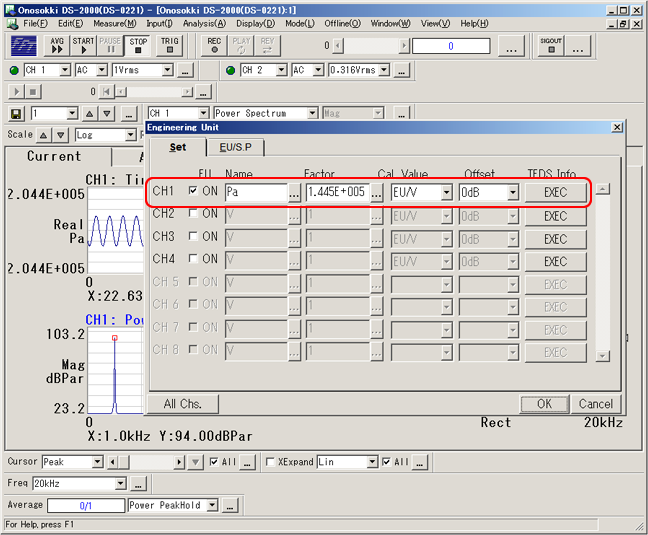
The figure 3 shows the state when the coefficient K is automatically set as a physical unit.

Figure 3 |
In the figure 3, the power spectrum is displayed in the scale of dB unit of the sound level meter, but the time waveform is not displayed as Pa unit. To display in Pa unit, it is necessary to convert it with the coefficient k.
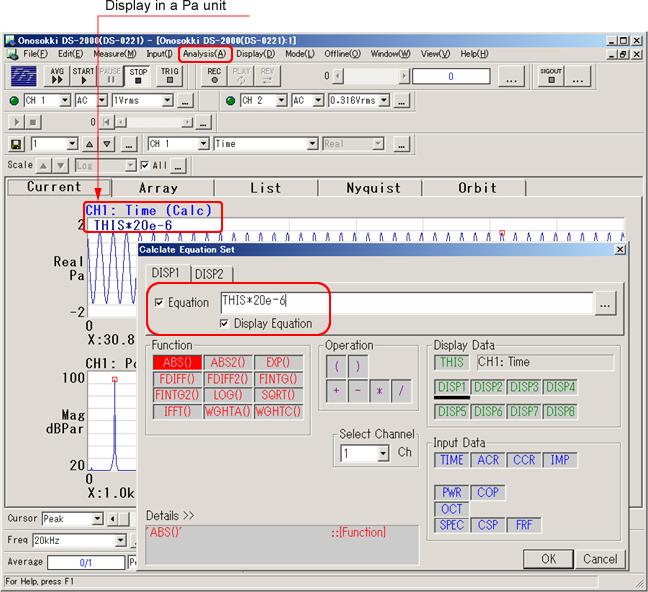
K is already set, so the time waveform becomes Pa unit when multiply 20 x 10-6 to it. This operation is executed in calculation function (figure 4).
◆Operation procedure
Activate the time-axis waveform by clicking it.
Click [Analysis > Calculation formula] to open [Calculate Equation Set] page. Then input the calculation formula as shown in figure 4 and put a check mark to [Equation] then click OK button.
Click [Data display > Y-axis scale] to change the scale to make it easy to observe.
Figure 4 |
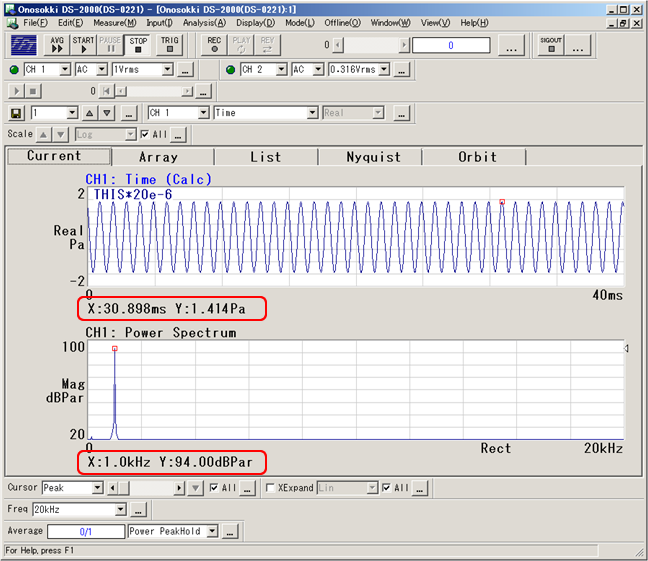
The figure 5 shows the result of measuring the CAL 94dB signal. This indicates the state when the time-axis waveform is Pa unit and the power spectrum is sound pressure level of dB unit.
Figure 5 |
Supplement
All explanations in here are when the CAL signal is 94dB. When the level range of the sound level meter is 90dB, the CAL signal is 84dB. To perform calibration with the CAL signal of 84dB, it is possible by replacing the number from 94dB to 84dB. After calibrating the power spectrum in 84dB, time-axis waveform can be displayed in Pa unit by multiplying 20 x 10-6.
Revised:2010.03.15