![]()
![]()
![]()


When the CF-0722 Tracking Analysis software is used to perform the tracking analysis, the data is stored as [trc] extension file which is for the tracking analysis. (Hereinafter refer to as trc file.) Tracking measured multiple spectrum data are collectively stored in this file. These data can be loaded and displayed in 3D. The operation procedure to load and display in 3D are the same for both constant ratio tracking and constant width tracking trc files. X-axis of the power spectrum for the constant ratio tracking is order (ord) and for constant width tracking is frequency (Hz). 3D display enables to observe the differences of these spectrum data. Each display examples are described in the followings. Same recorded data can be used in both constant ratio and constant width tracking analysis. This method is referred to as offline analysis.
■ 3D display operation procedure
【Constant ratio】
【Constant width】
3. Press [MAIN] > [TRACKING] > [DISPLAY] > [3D TRACKING COND] > [STEP AUTO ON] switches in this order. The setting numbers of line are displayed from trc: 1.
4. Press [MAIN] > [TRACKING] > [DISPLAY] > [3D ON] switches in this order to turn OFF [3D ON] switch and turn it ON again to update the display. The data of measurement rotation range (1000 r/min to 3000 r/min in here) are thinned out and optimally displayed.
■ 3D display setting operation
The tracking 3D display can be set while [3D ON] is turned ON. Please update the display of [3D ON] when the setting of [3D TRACKING COND] is changed.
Press [MAIN] > [TRACKING] > [DISPLAY] > [3D TRACKING COND] > [TRACKING CURSOR ON] switches in this order to turn OFF [TRACKING CURSOR ON]. When click the data area at this state, vertical and horizontal sectional views are displayed in the both top and left sides of the screen. The cross section (cursor marker) can be fine-adjusted by the [Search marker movement (four directions)] switch
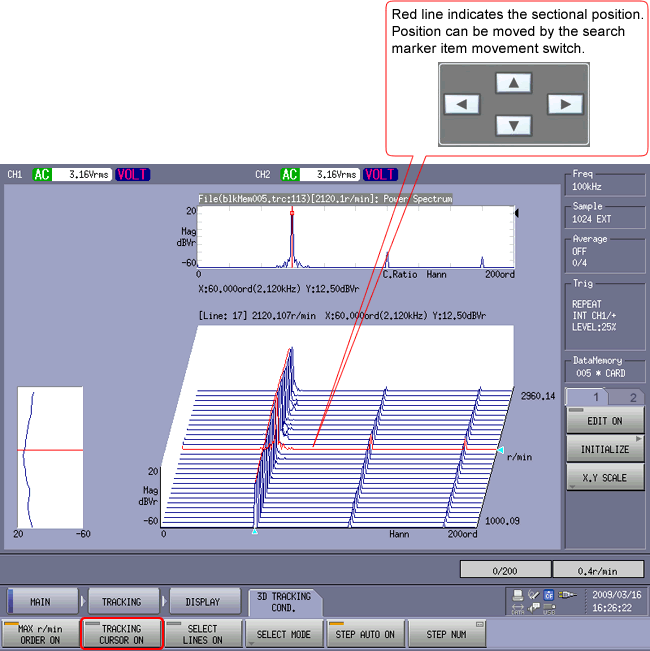
When the [TRACKING CURSOR ON] switch is turned ON, the vertical section of which frequency is same as the marker point is displayed in the constant ratio tracking, and vertical section of which order is same as the marker point is displayed in the constant width tracking.
【Constant ratio】
| Vertical red line: | Shows the same frequency position as the marker point. Left figure indicates the same cross section data. |
| X axis: | Order |
【Constant width】
| Vertical red line: | Shows the same order position as the marker point. Left figure indicates the cross section data. |
| X axis: | Frequency |
■ Specify the rotation range to be displayed
Display ranges of the rotation and block (trc) number can be specified. The following shows the setting example of the rotation range.
Press [MAIN] > [TRACKING] > [DISPLAY] > [3D TRACKING COND] > [SELECT MODE] > [r/min] switches in this order. Set the upper limit of the display rotation number with the [UPPER] switch, and lower limit of it with the [LOWER] switch.
Press [MAIN] > [TRACKING] > [DISPLAY] > [3D TRACKING COND] > [SELECT LINES ON] switches in this order to turn ON [SELECT LINES ON] switch.
Press [MAIN] > [TRACKING] > [DISPLAY] > [3D ON] switches in this order to turn OFF [3D ON] switch and turn it ON again to update the display. The specified rotation ranges (1500 to 2000 r/min in here) are displayed.
■ Specify the rotation range to be displayed
It is possible to turn the display order of the figure upside down.
1. Press [MAIN] > [TRACKING] > [DISPLAY] > [3D TRACKING COND] > [MAX r/min ORDER ON] switches in this order to turn OFF [MAX r/min ORDER ON] switch.
【Constant ratio】
【Constant width】

After update
After update
■ Change the 3D color display and number of line
Up until now, settings were in [MAIN > TRACKING > DISPLAY] section, from now on, settings are in [MAIN > DISPLAY] section. The display will be updated automatically by simply operate the setting, so update is unnecessary. After setting [MAIN > DISPLAY] section, you can return to [MAIN > Tracking > Display] section.
1. Press [MAIN] > [DISPLAY] > [3 D] > [SET 3 D COND] > [DRAW] switches in this order to turn ON [DRAW] switch. The data is displayed in color which is corresponding to the spectrum size.
【Constant ratio】

【Constant width】
2. Press [MAIN] > [DISPLAY] > [3 D] > [SET 3 D COND] > [COLOR] switches in this order to turn ON [COLOR] switch to display in color spectrum.
【Constant ratio】
【Constant width】
3. Press [MAIN] > [DISPLAY] > [3D] > [SET 3D COND] > [LINE NUM] in this order to switch the number of line for 3D drawing from 10, 20, 30, 50, 100, 200 or 400. LINE NUM = 100 is selected in the following figure.
■ Change the color scale
Change the color scale by setting the scale of Y axis arbitrary. Press [MAIN] > [DISPLAY] > [X.Y SCALE] > [Y AXIS] > [MANUAL] > [UP SCALE/LOW SCALE] in this order to set upper limit value of Y axis scale by [UP SCALE] and lower limit value of Y axis scale by [LOW SCALE]. In the following figure, the scale [20 dB to -60 dB] is changed to [0 to -80 dB] in the following figure.
Revised:(2009.04.20)