No.39 How to use the calculation function of FFT analysis in DS-3000 series
In this column, we will explain how to use the calculation function.
to obtain the sound pressure level of only the measured object after removing background noise in the measurement environment.
→ Subtraction of the power spectrum
to see the original frequency characteristics of the measured object after removing the characteristics of exciter.
→ Division of the frequency response function or Equalizer function
1. Subtraction of the power spectrum
The sound pressure level of noise generated from the machine with background noise as LT, the background noise as LB, the sound pressure level of noise generated from the machine as LS is obtained from the following calculation.
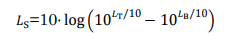
10 LT/10 , 10LB/10 are the square of the effective value of sound pressure. (See “Correction for background noise” in the Supplement.)
https://www.onosokki.co.jp/English/hp_e/whats_new/SV_rpt/SV_7/sv7_10.htm
Since the power spectrum is the square of the effective value, it can be processed by simply subtracting the power spectrum.
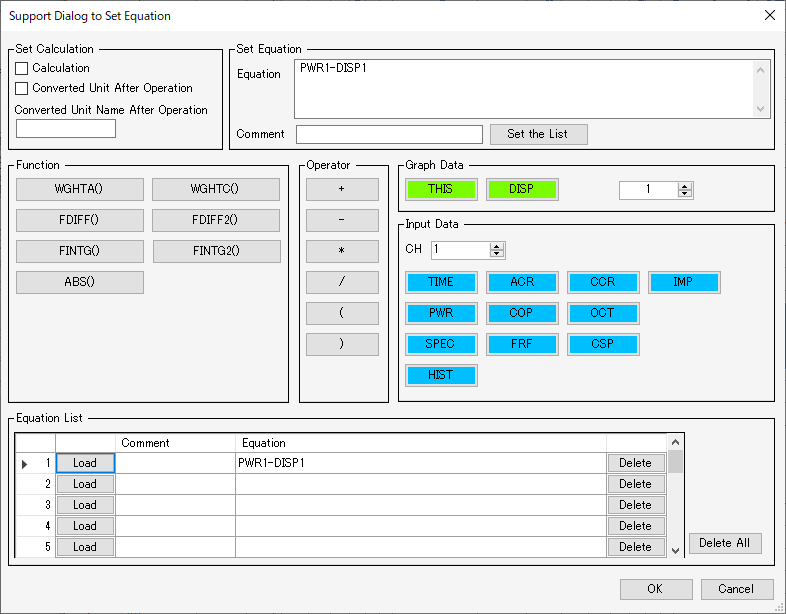
Display the saved power spectrum of the background noise level in the graph 1, the current power spectrum in the graph 2 and 3 and register PWR1-DISP1 as the equation of the graph 3.
Then, the graph 3 shows the sound pressure level without background noise.
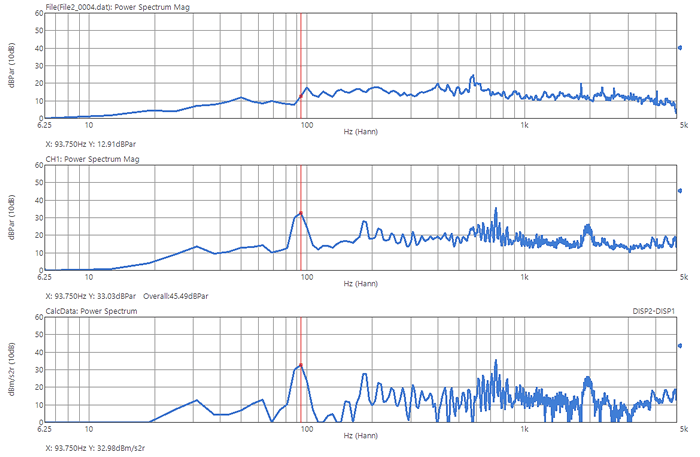
The shape of the power spectrum around 100 Hz to 300 Hz became clear and the overall value became the value without background noise.
2. The calculation of the frequency response function
The characteristic of exciter can be removed by division of the frequency response function.
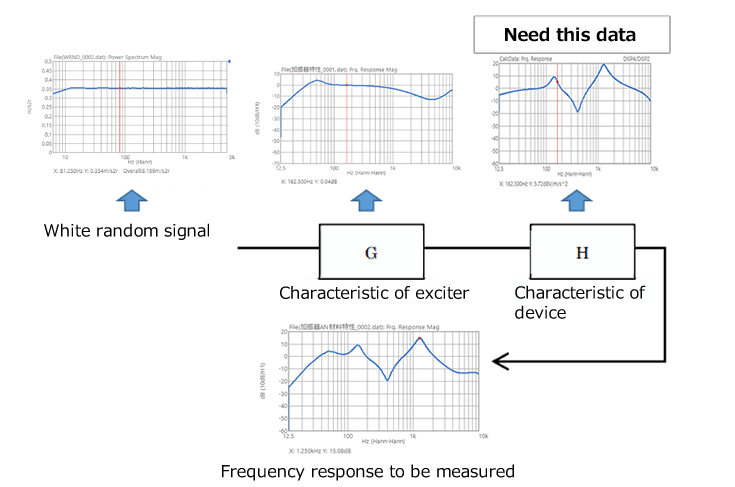
The characteristics of the exciter and the device are overlapped.
The measurement result will be G x H.
If the characteristics of exciter only is measured, the frequency response of only the device will be obtained. (H = the measurement result / G)
Display the saved frequency response of the exciter in the graph 1, the current frequency response in the graph 2 and 3 and registerFRF1,2 / DISp1 as the equation of the graph 3.
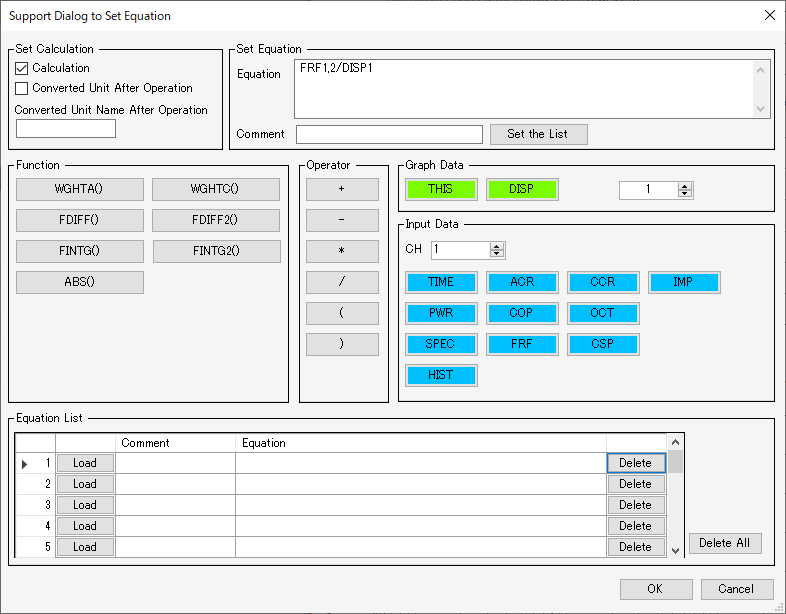
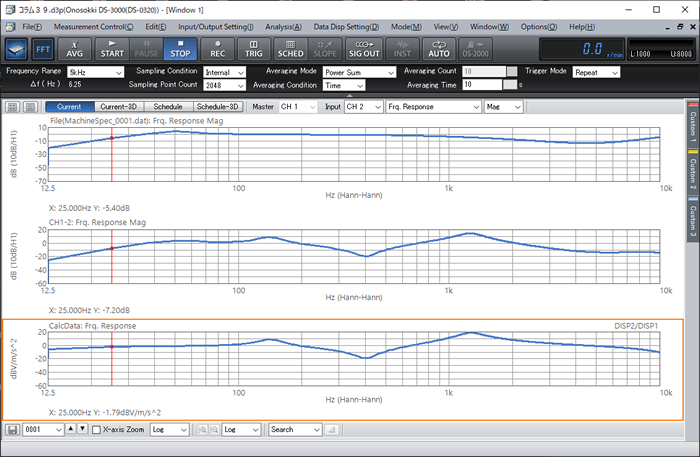
Then, the graph 3 shows the corrected frequency response.
It will be more easy to use an equalizer function.
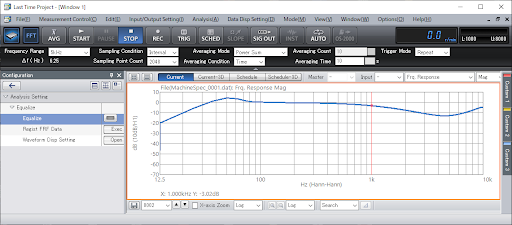
Open the equalizer function of analysis setting in the menu.
Display the frequency response function you want to remove and make it active.
Click EXEC button for FRF data registration.
Then, it has been registered.
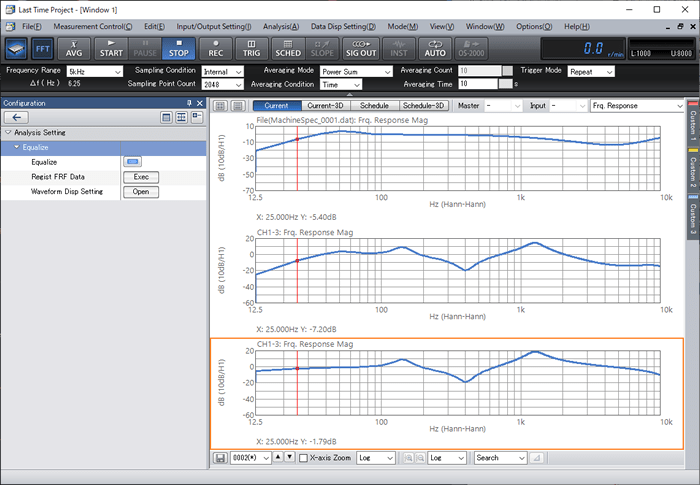
Make the frequency response to be equalized active.
Turn on Equalization process (blue button)
The graph is proceed and the data will be displayed.
The advantage of the equalization process is that you can calculate the frequency response function without displaying it.
Use calculation function and an equalizer function accordingly.
(HK)