![]()
![]()
![]()
What is sound level meter?
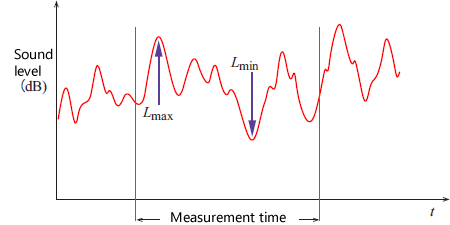
9-5 Maximum and minimum of Time weighting Sound Level
The maximum time weighting sound level within a certain measurement time is expressed as Lmax, and the minimum time weighting sound level is expressed as Lmin.
Lmax is defined by JIS C 1509-1.
|
Figure 9-4: Fluctuating sound level and the maximum and minimum values |
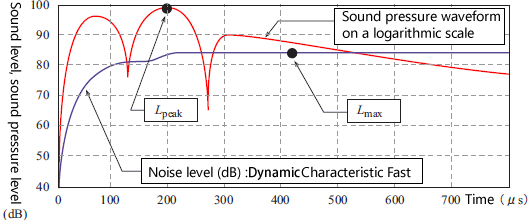
A peak sound level is the maximum absolute instantaneous sound pressure (AC out waveform) over a time period presented on a logarithmic scale. With isolated burst signals, there is a significant difference between LPeak and the maximum sound level (Lmax) as shown in Figure 9-6. With steady-state sine waves, LPeak shows the amplitude of the sine waves (peak value) and Lmax shows the root mean square value, resulting in a difference of around 3 dB.
| (Equation 9-7) |
|
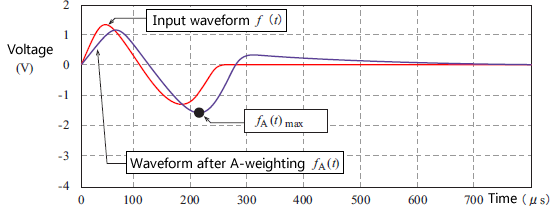
where f0 is the AC out value when the reference sound pressure (Pa) = 2 × 10⁻⁵ and fA(t) max is the maximum value of the AC out (instantaneous sound pressure) waveforms.
|
Figure 9-5: Change in waveform after A-weighting of input signals |
|
Figure 9-6: Difference between peak values Lmax
and Lpeak
of input signals |
|
NOTE:
(1) Maximum time weighting Sound Level
(2) Peak sound level
|
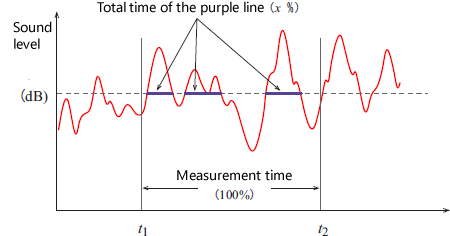
9-7 Percentile Sound Pressure Level (Lx)
This parameter has been used for many years as a measure of fluctuating sound. It is also listed as a measure of noise in the Noise Regulation Act. The parameter is effective for clarifying the distribution of the levels of irregularly and significantly fluctuating noise.
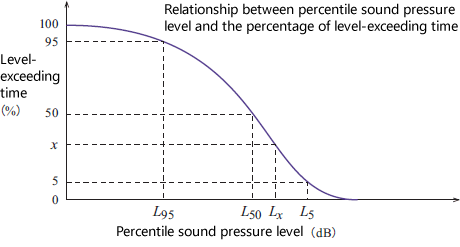
With reference to Figure 9-7, which shows fluctuating sound over a measurement time period, when the total of the time when the sound exceeds a certain level is x% of the measurement time T = t2 − t1, the sound level is called x % of the percentile sound pressure level and is abbreviated to Lx . Figure 9-8 shows the relationship between percentile sound pressure level (horizontal axis) of typical fluctuating noise and the percentage of level-exceeding time (vertical axis).
NOTE: Percentile Sound Pressure Level is not specified in JIS C 1509-1, but N percentage exceedance A-weighted sound pressure level is specified in JIS Z 8731. |
Figure 9-7: Fluctuating noise and percentile sound pressure level |
Figure 9-8: Relationship between percentile sound pressure level and the percentage of level-exceeding time |
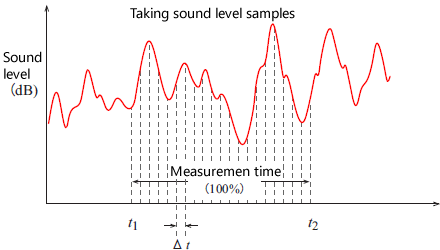
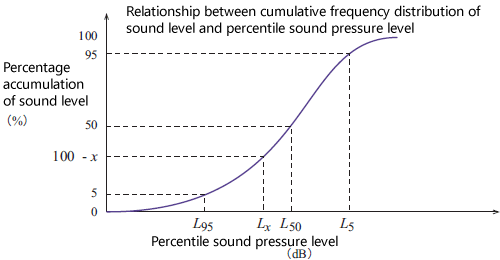
In practice, percentile sound pressure level is obtained by, as shown in Figure 9-9, taking samples of noise level for every time segment Δt and processing the data statistically. In a typical processing, the cumulative frequency distribution is obtained from the samples and the noise level with a percentage accumulation of (100 − x) % is determined as x % of the percentile sound pressure.
In Japan, 50 % of percentile sound pressure level L50 is called median sound pressure level, 5 % of percentile sound pressure level L5 and 95 % of percentile sound pressure level L95 are called the upper and lower limit of the 90 % (= 95 % – 5 %) range, and 10 % of percentile sound pressure level L10 and 90 % of percentile sound pressure level L90 are called the upper and lower limit of the 80 % range. These, collectively called the five parameters, have been widely used for evaluating fluctuating noise. When measuring percentile sound pressure level, normally 50 measurements are taken, with each lasting five seconds (Δt).
Figure 9-9: Sound level samples and percentile sound pressure level |
Figure 9-10: Cumulative frequency distribution of noise level and percentile sound pressure level |