
In order to identify dynamic characteristics from the subject as information, the status of the subject system must be measured with the frequency of vibration (frequency). An ‘exciting force’ is employed as input in order to vibrate the subject. ‘Displacement', ‘velocity’, and ‘acceleration’ are frequently used as responses, and ‘sound’, ‘strain’, and ‘stress’ are also used. The transfer function is referred to as the frequency response function.
The most commonly used indices are the following three, and mechanical impedance. Under international standards, mobility is the reference of the frequency response function (ISO 7626).
| Displacement/Force | Compliance (m/N) |
| Velocity/Force | Mobility |
| Acceleration/Force | Accelerance* |
| Force/Displacement | Dynamic stiffness (N/m) |
| Force/Velocity | Mechanical impedance (Ns/m) |
| Force/Acceleration | Dynamic mass (Ns2/m) |
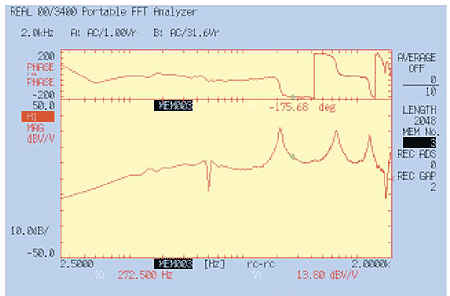
Bode plot
Displays frequencies on the horizontal axis, and amplitude and phase on the vertical axis. The Bode plot is most commonly used since it permits ready verification of the location of the resonance peak and the magnitude of the frequency, and differentiation and display of amplitude and phase.

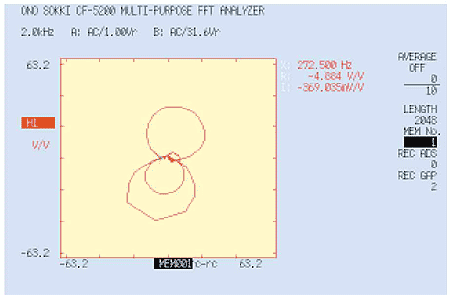
Nyquist plot
Displays the relationship between the real and imaginary parts on a complex plane in which the real part is displayed on the horizontal axis, and the imaginary part on the vertical axis. It is characterized by enlargement only in the vicinity of important resonance points. On the other hand, frequencies are not apparent, and frequencies are therefore displayed on the curves in many cases. The CF-5200 Series conduct search on this complex plane to permit display of the frequencies. A 3D plot with the frequency axis as the Z axis is also possible.

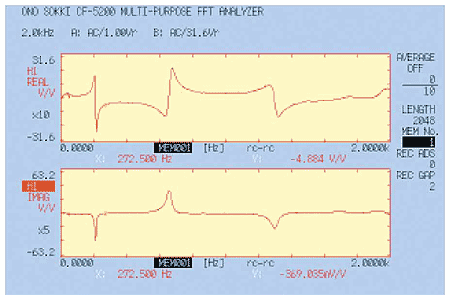
Co.quad.plot*
Displays the frequency on the horizontal axis, and displays the real and imaginary parts on the vertical axis vertically in two diagrams. This graph has the advantages of providing a clear understanding of phase changes in the vicinity of the resonance point, and a steeper peak than the Bode plot for the resonance peak, which appears as the imaginary part, and is thus more readily distinguished. However, the logarithmic scale cannot be used on the vertical axis, and it is difficult to obtain good accuracy with mild damping. Since the magnitude and phase of vibration do not directly appear on the plot, it is used infrequently.
* Also referred to as the Re-Im plot.

Revised:2004.04.19