![]()
![]()
![]()


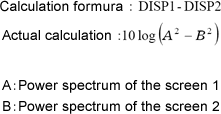
Use the calculation formula to obtain the calculation display of the power spectrum. In the time of simultaneous measurement of ch1 and ch2, the difference of the power spectrum can be obtained by the following calculation formula.
The PWR 1 is the power spectrum for ch1 and PWR 2 is for ch2.
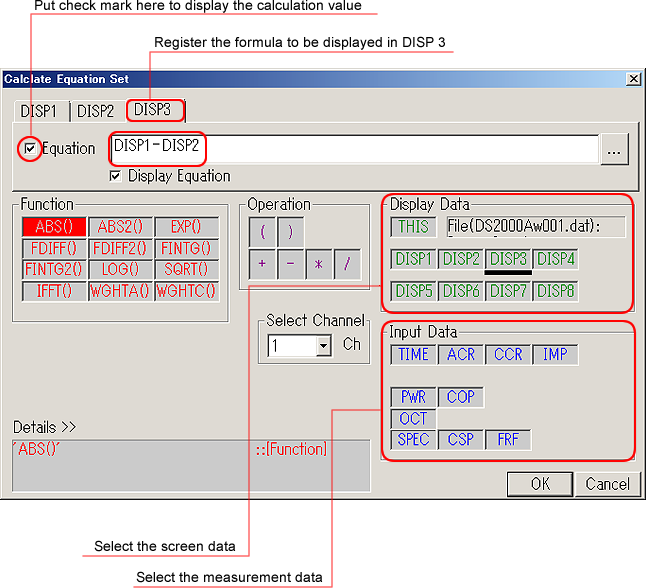
If the power spectrum is recorded data, calculation is operated after calling it to the screen. To input the calculation formula, click the registered name from screen data in the input data section of the calculation formula setting screen, or input on a keyboard. When it is three-screen display, the screen data from the above are corresponding to the DISP 1 to DISP 3. The calculation formula can be selected by the screen data display position. The followings are example of displaying stored data on the screen 1 and 2, and calculated results on the screen 3.
Measurement example
1. Click [Data display] > [Layout setting] in this order to set the display to three-screen.
2. Click [Data display] > [Input power setting] in this order to display ch1 power spectrum on the screen 1.
3. Click [File] > [Open] in this order to display the power spectrum of the stored data on the screen 2.
4. Click the frame of the screen 3 (third line) to activate it (The characters of the data are changed into blue.).
5. Click [Analysis] > [Calculation formula setting] in this order to open the calculation formula setting screen, and input the following formula on the screen 3. Put check mark on the [Calculation] and click OK button, the calculation is executed and the results are displayed in the screen 3.
 |
Calculation formula setting screen
 |
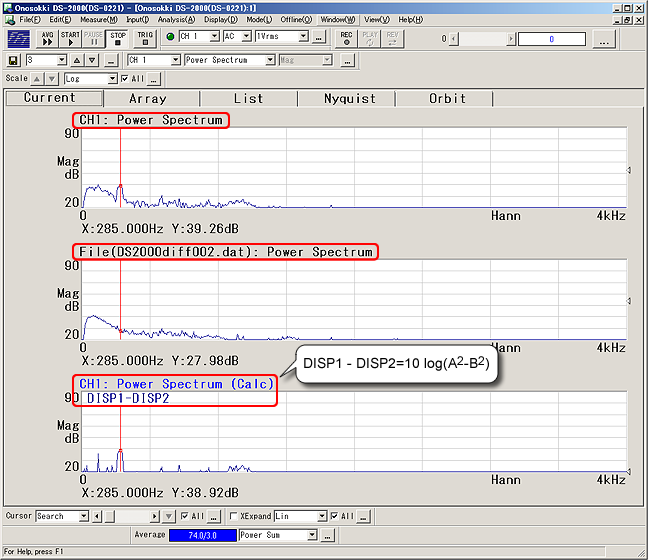
Calculation results display
 |
<Memo>
The square value of amplitude A (effective value) is stored as a power spectrum data. According to this value, 10 logA2 is displayed when Y-axis scale is log, and √A2 is displayed when it is LIN.
From the above formula, following calculation is executed.
●When Y-axis is LIN scale
●When Y-axis is log scale (dB)
Revised:2007.04.16