![]()
![]()
![]()


The tracking data is displayed as following table according to the setting difference. The followings are an example when the band width is set as [5].
Peak Search |
Order Band |
Data drawing |
Graph display |
|
1 |
OFF |
OFF |
Only displays the tracking data with a setting order point. | The peak point is displayed in the red square. |
2 |
ON |
OFF |
Displays the peak data which is found from the band width of 5 points by setting the selected order as a center point. The peak point may be changed in every rotation. | The found peak point is displayed in the red square. |
3 |
OFF |
ON |
Displays the partial overall value which is obtained from the band width of 5 points by setting the selected order as a center point. | Band width is displayed in red line. |
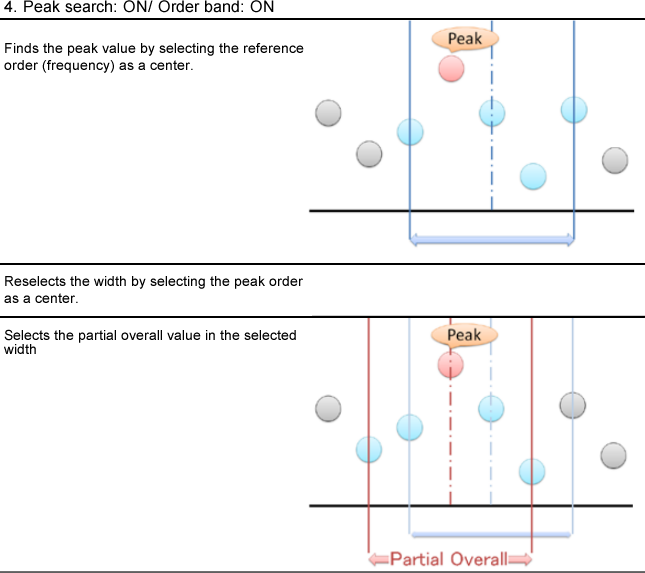
4 |
ON |
ON |
The peak data which is found from the band width of 5 points by setting the selected order as a center point is set as a center point in the band width of 5 points to obtain and display the partial overall value. The peak point may be changed in every rotation. | The found peak point is displayed in red square, and band width is displayed in red line. |
|
|
Revised:2008.11.17