![]()
![]()
![]()


Operation procedure
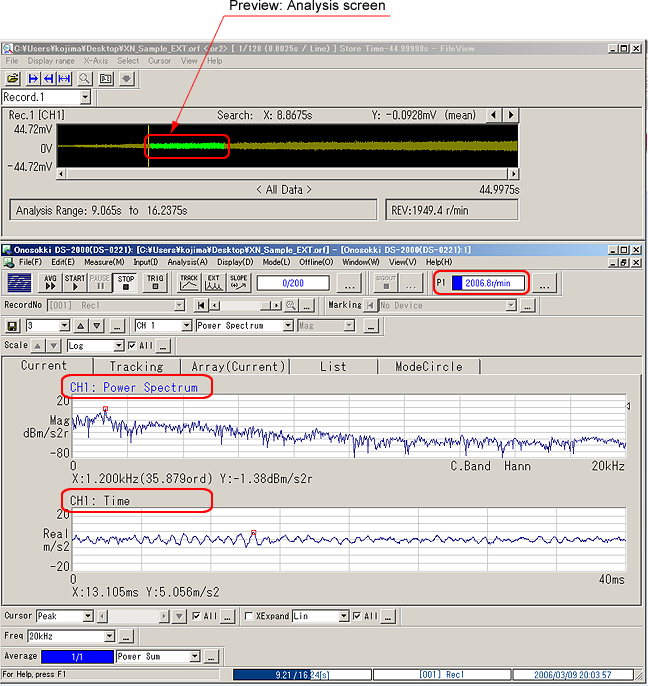
1. Click [Offline] > [Preview] to open the [File View]. Preset the area including the specified rotation speed as the analysis range by the operation of the preview side. (Decide the beginning of analysis of ORF file.)
|
2. Set the DS-0222 tracking software side as follows.
| ●Setting of averaging processing | ||
|---|---|---|
| Averaging mode | Power spectrum additional averaging | |
| Averaging method | Number of times | |
| Number of averaging | One time | |
| ●Setting of sample condition | ||
| Sampling points | Appropriate points, such as 2048 points | |
| Overlap amount | 50 % | |
When you click AVG button, first 2048 sampling points data which is selected as the analysis range in the above procedure 1 are displayed. (Check the rotation speed monitor.)
When you click AVG button again, 1024 points of data are updated and displayed due to the overlap setting of 50 %. (Check the rotation speed monitor.)
3. Repeat this operation. The data is overlapped for 50 %, so it is never dropped.
|
Revised:2006.08.21