No.9 Calculation method of Power Spectral density
In this column, I will explain about the calculation method for power spectral density (PSD).
When a non-periodic signal such as a random signal (signal having a continuous spectrum) is performed by FFT analysis, the amplitude value of each component of the obtained power spectrum depends on the frequency resolution Δf. Thus, if the analysis conditions are changed, the value will be changed. In such cases, the power spectral density (PSD), which is expressed as a power value per unit frequency range (1 Hz width), is used so that the value of the analysis result does not depend on Δf.
●Relationship between Power spectrum and Frequency resolution Δf
When performing FFT analysis, the relationship between the frequency range, the number of sample points, and the frequency resolution is as follows:
Number of lines= Sampling points ÷ 2.56
Frequency resolution Δf = Frequency range ÷ Number of lines
The figure 1 shows the power spectra obtained by FFT analysis of signals with continuous spectra. Frequency range: 2 kHz, Sampling points: 512, 1024, 2048, and Frequency resolution Δf: 10, 5, 2.5 Hz.
The amplitude values of the 1 kHz component were 0.515 m/s2, 0.337 m/s2, and 0.234 m/s2, respectively. For an ideal random signal, if the frequency resolution Δf is half, the amplitude value is √ 1/2.
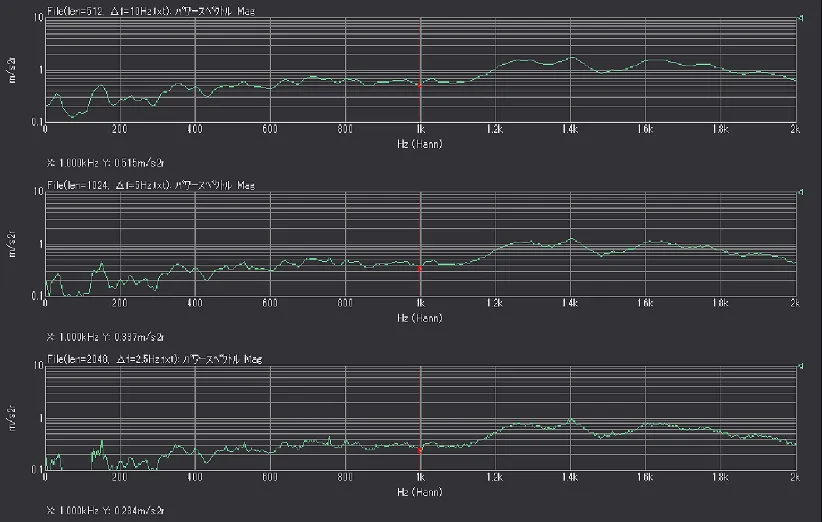
Fig.1 Spectra with different sampling points (Upper: 512, middle: 1024, lower: 2048)
When FFT analysis is performed with 512 of sampling points, the frequency resolution is 10 Hz, and the power spectrum has 10 Hz of bandwidth.
As for 1024 of sampling points, the frequency resolution is 5 Hz. Since the bandwidth is half, the power value (squared value of amplitude) is half compared to the 512 of sampling points, and the amplitude value is √ 1/2.
Strictly speaking, the value of 1000 Hz in the analysis result at 512 points does not have only the components from 995 Hz to 1005 Hz, but also a slightly wider range of components due to the window function. Even if sampling points or frequency resolution changes, the above relationship will apply as it is.
●Calculation method of power spectral density
To display the power value per unit frequency range (1 Hz width) of the power spectrum obtained by FFT analysis, divide the power value (squared value of amplitude) by Δf.
Actually, simply dividing by Δf is not the correct value due to the window function (Hanning, flat top), thus, the power spectral density (PSD) is calculated by the following equation.
PSD= Power value ÷ (Δf xWf)
= Amplitude2 ÷ (Δf xWf)
Wf is the correction value for each window (window function). The reciprocal of the correction value Hf when calculating overall (OA) and partial overall (POA) is the correction value Wf when calculating the power spectral density.
Table 1. Correction value at PSD for each window function
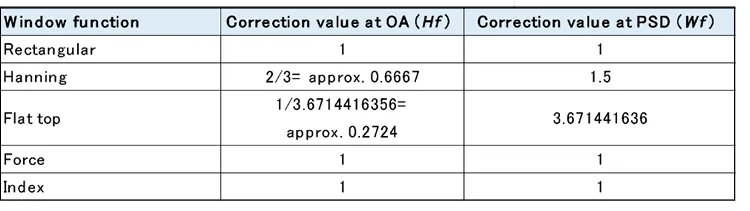
The unit of power spectral density (PSD) is [the unit of amplitude value2 / Hz]. If the unit of the amplitude value is m/s2, it will be [(m/s2) 2 / Hz], and if the unit of the amplitude value is V, it will be [V2 / Hz].
The unit of power spectral density (PSD) is expressed as in the above, but the square root of PSD sometimes is used. In this case, the unit of the square root of PSD is expressed as [m/s2 / √Hz], [V / √Hz], and so on. When comparing the measurement results or the specifications of the target products, it is necessary to confirm whether the unit of those PSD values is [the unit of amplitude value2/ Hz] or [the unit of amplitude value/ √Hz], and align the units.
Our FFT analyzer has a PSD display function. You can select V2 or V. If you select V2, the PSD value is displayed as [the unit of amplitude value2/ Hz]. If you select V, PSD value is displayed as [the unit of amplitude value/ √Hz].
●PSD calculated from acceleration power spectrum
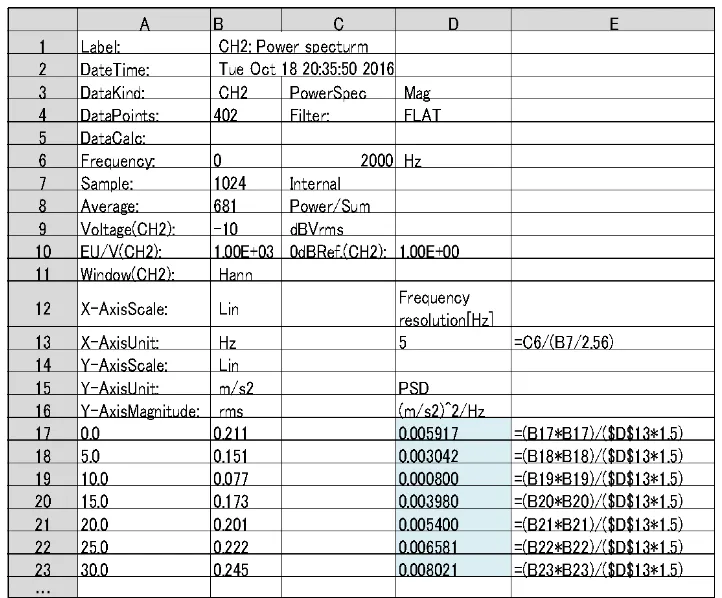
Table 2 shows an example of the acceleration power spectrum analyzed by an FFT analyzer in the Excel table. Since the frequency range (cell:C6) is 2000 Hz and the sampling points (cell:B7) is 1024 points, the frequency resolution becomes 5 Hz. The cell from A17 to A417 show frequency values from 0 Hz to 2 kHz in 5 Hz increments.
As “Lin” is indicated in B14, it means that the data measured with the Y-axis scale is set to Lin. As for the values from B17 to B417, they are the physical values (acceleration values) of each frequency component. If the Y-axis scale shows “MagLog”, the data measured with the Y-axis scale is set to Log/MagLog. In this case, the values in cells B17 to B417 are also acceleration values of each frequency component.
When entering equations shown in the E17 to E417 into the D17 to D417, the Power Spectral Density (PSD) value will appear there. The unit is [(m/s2) 2 / Hz].
Since the Y-axis Magnitude (cell: B16) is rms, the values in the cell from B17 to B417 are efficient values (RMS values). Thus, the power spectral density (PSD) value obtained by the above method is also the efficient value (RMS value).
Table2. PSD calculated from acceleration power spectrum
●PSD calculated from voltage signal power spectrum
Table 3 shows an example of the voltage signal power spectrum analyzed by an FFT analyzer in the Excel table. Since the frequency range (cell:C6) is 2000 Hz and the sampling points (cell:B7) is 1024 points, the frequency resolution becomes 5 Hz. The cell from A17 to A417 show frequency values from 0 Hz to 2 kHz in 5 Hz increments.
The data with the Y-axis scale (cell:B14) set to Log is the data measured with the Y-axis scale set to Log, and the values from B17 to B417 are decibel value of each frequency component.
Table 3. PSD calculated from voltage power spectrum
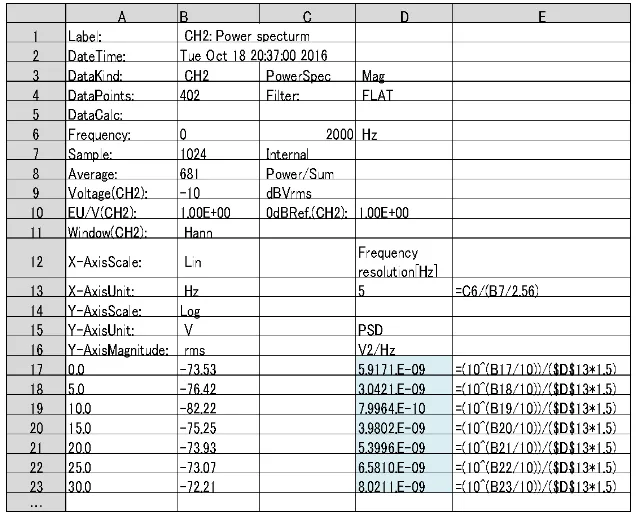
When entering equations shown in the E17 to E417 into the D17 to D417, the Power Spectral Density (PSD) value will appear there. The unit is [V 2 / Hz].
This time, the equation 10 ^ (decibel value / 10) is used as to convert the decibel value to the power value (the squared value of amplitude).
Since the Y-axis Magnitude (cell: B16) is rms, the values in the cell from B17 to B417 are efficient values (RMS values). Thus, the power spectral density (PSD) value obtained by the above method is also the efficient value (RMS value).
●Summary
I explained how to calculate the power spectral density (PSD) from the power spectral obtained by FFT analysis.
Although our FFT analyzers have the functions of calculating, displaying PSD, you may calculate with the above method without using the functions.
The power spectral density (PSD) is displayed as the power value (the squared value of amplitude) per 1 Hz, and the unit is [the unit of amplitude value2 / Hz], that is, [(m / s2) 2/ Hz], [V2 / Hz] and so on.
When performing FFT analysis and comparing with the results and specification measured in the past, please confirm if the measured value is the power spectral density (PSD) or just power spectrum, and the unit is [the unit of amplitude value2 / Hz] or [the unit of amplitude value √Hz]. Then, adjust the unit and measurement conditions before measurement.
(Y·K)