No.8 Calculation method of Partial Overall
In this column, I will explain about the calculation method for the overall (OA) and the partial overall (POA) of the power spectrum analyzed by FFT. The overall value is the total sum of the power values of all frequencies analyzed by FFT. The partial overall is the sum of the power values of the limited frequencies.
●Calculation method for the overall (OA) and the partial overall (POA)
The overall (OA) can be calculated by Equation 1. The overall (OA) value obtained by this equation is the square of the physical value. If you want to display the overall value as physical value instead of square value, take the square root of the result of Equation 1.
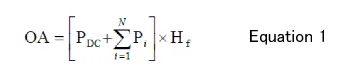
PDC :Power value of DC component
Pi :Power the i-th component of power spectrum (equivalent to square value)
N : Number of frequency lines
Hf : Compensation value for window
The partial overall (POA) can be calculated by changing the range (inside the brackets) in Equation 1.
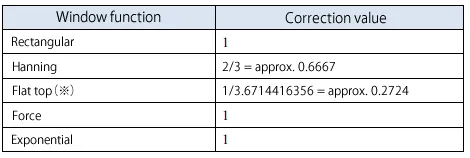
Table 1 shows the correction value Hf for each window (window function). Note that the correction value of the flat top (*) is the one of our DS-3000 series Data station, CF-9000 / CF-4700 FFT analyzer. In addition, other companies' products may use a flat top window function with a different shape from ours, in which case the correction value will be different.
Table 1 Correction value for each window function
●Overall (OA) calculated by acceleration power spectrum
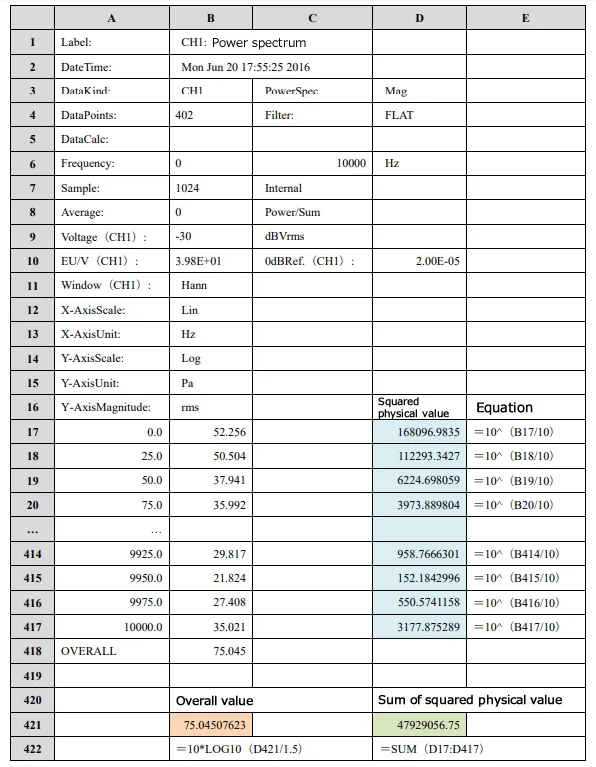
Table 2 shows an example of the acceleration power spectrum analyzed by an FFT analyzer in the Excel table. Since the frequency range (cell:C6) is 1000 Hz and the sampling points (cell:B7) is 1024 points, the frequency resolution becomes 25 Hz. The cell from A17 to A417 show frequency values from 0 Hz to 10 kHz in 25 Hz increments.
As “Lin” is indicated in B14, it means that the data measured with the Y-axis scale is set to Lin. As for the values from B17 to B417, they are the physical values (acceleration values) of each frequency component.
If the Y-axis scale shows “MagLog”, the data measured with the Y-axis scale is set to Log/MagLog. In this case, the values in cells B17 to B417 are also acceleration values of each frequency component.
If you enter the equation shown in Table 2 for each of D17 to D417, and D421, the physical quantity (acceleration value) of the overall (OA) will be shown in B421. The square of the physical values of each frequency component are entered in D17 to D417. The equation, "SQRT (D421 / 1. 5)" is entered in B421. Dividing by 1.5 corresponds to the process of multiplying the correction value (2/3) of the Hanning window function. The equation, "SUM (D17: D417)" is entered in cell D421. The partial override (POA) can be calculated by changing the range for the sum of this equation.
Since the Y-axis Magnitude (B16) is rms, the values from B17 to B417 are efficient values (RMS values). Therefore, the overall (OA) and partial overall (POA) values obtained by the above method are also efficient values (RMS values).
Table2. Overall (OA) calculated from acceleration power spectrum
●Overall (OA) calculated by sound pressure level power spectrum
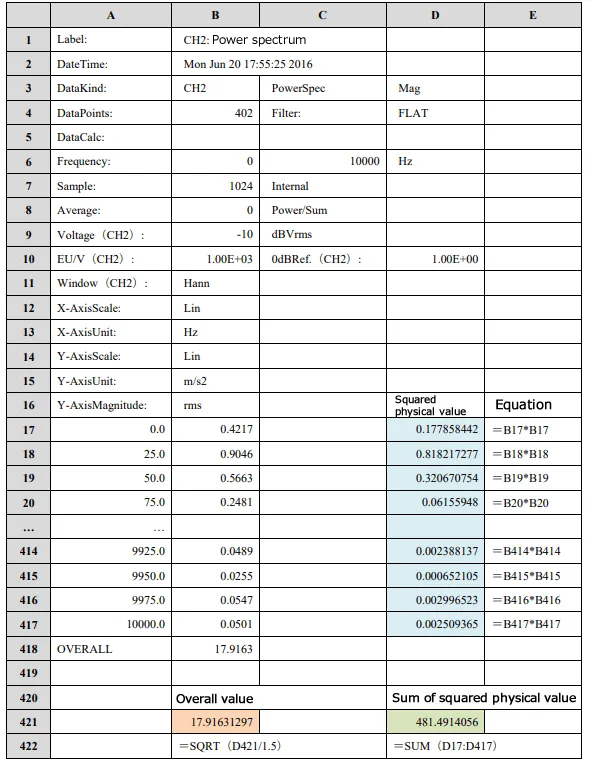
Table 3 shows an example of the sound pressure level power spectrum analyzed by an FFT analyzer in the Excel table. Since the frequency range (C6) is 1000 Hz and the sampling points (B7) is 1024 points, the frequency resolution becomes 25 Hz. The cell from A17 to A417 show frequency values from 0 Hz to 10 kHz in 25 Hz increments.
As “Lin” is indicated in B14, it means that the data measured with the Y-axis scale is set to Lin. As for the values from B17 to B417, they are the decibel values (sound pressure level values) of each frequency component.
If you enter the equation shown in Table 3 for each of D17 to D417, and D421, the decibel values (sound pressure level values) of the overall (OA) will be shown in B421. The square of the sound pressure values obtained from the decibel value of each frequency component are entered in D17 to D417. The equation, “10*LOG10(D421/1.5)” is entered in B421. Dividing by 1.5 corresponds to the process of multiplying the correction value (2/3) of the Hanning window function. “10*LOG10” corresponds to the process of converting the sound pressure squared value to a decibel value. The equation, "SUM (D17: D417)" is entered in cell D421. The partial override (POA) can be calculated by changing the range for the sum of this equation.
Since the Y-axis Magnitude (B16) is rms, the values from B17 to B417 are efficient values (RMS values). Therefore, the overall (OA) and partial overall (POA) values obtained by the above method are also efficient values (RMS values).
Table3. Overall (OA) calculated from sound pressure level power spectrum
●Correction value for Hanning window function
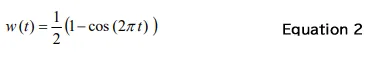
When FFT analysis is performed using the Hanning window function, it may affect the value of each frequency components and overall (OA). Therefore, an FFT analyzer corrects the influence and displays each frequency components and overall (OA) value. The Hanning window is defined as Equation 2.
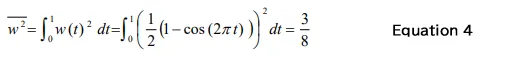
The mean value w and the squared mean value w2 of the Hanning window function can be calculated by Equation 3 and 4, respectively. When applying window function to a stationary time-axis waveform, the mean of the time-axis waveform will be 1/2, the squared mean will be 3/8.

If the time axis waveform after applying the window function is FFTed without correction, the amplitude of the obtained power spectrum will be half. Therefore, the power spectrum is doubled in amplitude ratio (4 times in power ratio) to correct the amplitude.
The Overall (OA) is the mean squared value, so it is 3/8. The overall (OA) value after the amplitude correction (4 times of the original amplitude) is 3/2 (=3/8 x 4) times of the original value.
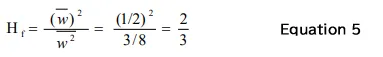
Therefore, when calculating the overall (OA) from the power spectrum, the correction value Hf = 2/3 is applied to the sum of the components (power values) of the spectrum.
The correction value of overall can be obtained by Equation 5 using the mean value w and the squared mean value w2 of the Hanning window.
If the overall (OA) and partial overall (POA) are calculated without this correction, the values will be 1.5 times greater in power ratio and about 1.225 times higher in amplitude ratio than the original values. The decibel value is about 1.761 dB greater.
●Correction value for Flat top window function
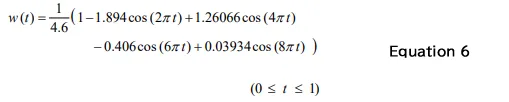
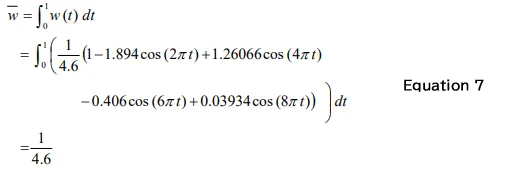
The Flat top window is defined as Equation 6.
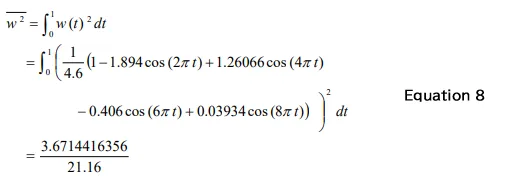
The mean value w and the squared mean value w2 of the Hanning window function can be calculated by Equation 7 and 8, respectively. When applying window function to a time-axis waveform, the mean of the time-axis waveform will be 1/4.6, the squared mean will be 3.6714416356 / 21.16.
If the time axis waveform after applying the window function is FFTed without correction, the amplitude of the obtained power spectrum will be 1/4.6. Therefore, the power spectrum is 4.6 times in amplitude ratio (21.16 times in power ratio) to correct the amplitude.
Since the overall (OA) value after the amplitude correction is deviated from the original value, multiple by correction value (Hf = 1/3.6714416356) to correct.
The correction value, Hf of overall can be obtained by Equation 9 using the mean value w and the squared mean value w2 of the Flat top window
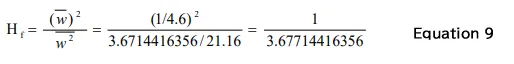
If the overall (OA) and partial overall (POA) are calculated without this correction, the values will be about 3.667 times greater in power ratio and about 1.918 times higher in amplitude ratio than the original values. The decibel value is about 5.655 dB greater.
●Summary
I have explained about the calculation method for the overall (OA) and the partial overall (POA) of the power spectrum analyzed by FFT.
Since the value will be greater due to the influence of the window function applied in FFT analysis, it is necessary to apply the correction value determined by the form of the window function when calculating.
(Y·K)