No.45 Harmonic analysis for voltage/current waveform of AC power supply to know the waveform distortion
Under normal circumstances, the electrical power supply has a frequency of 50 Hz or 60 Hz representing a single sine wave. However, due to a pulsating circuit load of a device, an actual current includes large harmonic components and does not represent a sine wave. This harmonic distortion flows into the supply and distribution systems and may cause disorder such as abnormalities on other connected equipment, failures, and electrical noise.
he harmonic may occur in solar battery generation, too.
The power generated by the solar cell module is DC power. To use DC power at home or in the office, it is necessary to convert it to AC power with a power conditioner. However, due to the DC-AC conversion circuit in the power conditioner system, the converted voltage does not always become a clean sine wave, but a distorted waveform containing harmonic components, which adversely affects the connected electronic devices.
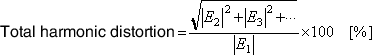
The index of the waveform distortion is expressed by the total harmonic distortion factor.
When the output waveform consists of the fundamental frequency f1, the 2nd order harmonic frequency f2, the 3rd order harmonic frequency f3 and other harmonic components, and if the RMS value of each component is | E1 |, | E2 |, | E3 |,..., the total harmonic distortion is defined as
When the harmonic distortion in the n-th harmonic component is focused, the following n-th order relative harmonic content is used:

(It is called distortion factor.)
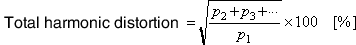
How much harmonic distortion is contained can be analyzed with the FFT analyzer. The total harmonic distortion can be expressed using the power spectra p1, p2, p3… of each frequency as follows.

For example, if the power supply current is captured by a clamp type ammeter and analyzed by an FFT analyzer, harmonic distortion of higher order component and total harmonic distortion of the fundamental wave (50 Hz or 60 Hz) and can be evaluated.
An FFT analyzer has the functions to calculate the total harmonic distortion and the relative harmonic content. If the fundamental wave is set, an FFT analyzer automatically lists up harmonic waves and displays the total harmonic distortion and the relative harmonic content.
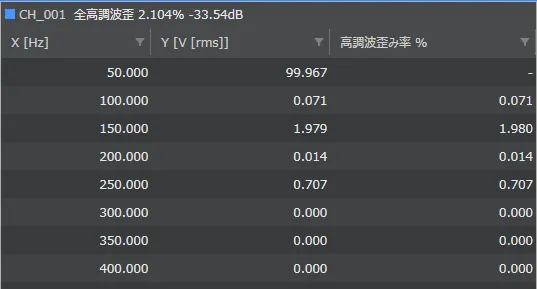
The analysis example of O-Solution* is shown in the figure below.
Each relative harmonic content is displayed in the list and the total harmonic distortion is displayed on the top of the list.
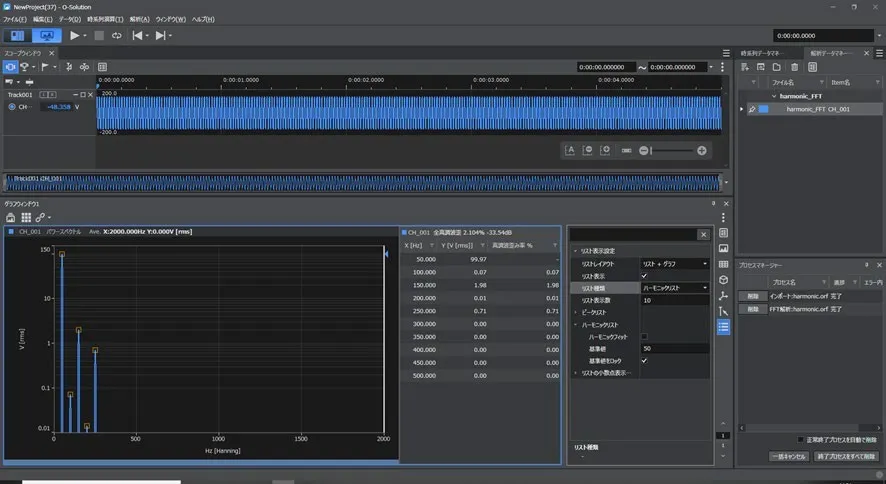
Example of List display
The FFT analyzer easily enables analysis of the harmonic distortion.
*O-Solution DS-5000 Sound and Vibration Analysis System
https://www.onosokki.co.jp/English/hp_e/products/keisoku/data/os_ds/ds5000_osolution.htm
Application examples
Measurement and evaluation of the current harmonic components from a motor
https://www.onosokki.co.jp/English/hp_e/products/keisoku/ev/m_apli1.htm
Measurement and evaluation of harmonic component of current flowing electric and electronic devices
https://www.onosokki.co.jp/English/hp_e/products/application/FFT/fft_o_1_3.htm
(H·K)