Fourier t![]() ransform was discovered by a French mathematician and scientist, Fourier, as a natural progression of his Fourier series theory. The Fourier series theory states that any waveform, however complicated, can be expressed as a series of two or more simple sine waves and cosine waves, if the waveform is periodical, that is, composed of the same repeated waveforms. The mathematical expression of this theory is called Fourier series. Fourier transform involves expansion of the Fourier series from -
ransform was discovered by a French mathematician and scientist, Fourier, as a natural progression of his Fourier series theory. The Fourier series theory states that any waveform, however complicated, can be expressed as a series of two or more simple sine waves and cosine waves, if the waveform is periodical, that is, composed of the same repeated waveforms. The mathematical expression of this theory is called Fourier series. Fourier transform involves expansion of the Fourier series from -![]() to + and developed.
to + and developed.
It is not always clear the extent to which a signal can be actually measured and determined as periodical, especially when measuring the waveform up to infinity, as it becomes fainter and fainter. Thus, in general, only a part of the observed waveform is cut out and Fourier transform performed on this period of the waveform assuming that the waveform pattern is infinitely repeated. Originally, this Fourier transform calculation required a tremendous number of multiplication calculations. However, J.W. Cooley and J.W. Tukey proposed a method of calculation that reduces the number of individual calculations by taking the number of data items as equal to 2n. If the number of data items is assumed to be 1024, the number of multiplications, that is 1024 x 1024 = 1048576, is reduced to 10240. This method was called Fast Fourier Transform and is often referred to by its acronym, FFT.
An FFT calculation tangibly indicates how the coefficients of a Fourier series (Fourier coefficients) are determined. An FFT analyzer stores an input signal waveform as data by digitally (discretely) sampling it, determines the Fourier coefficients in a short time using FFT, and displays the results of this analysis. Since FFT basically involves resolving a signal into simple frequencies by expressing the value of frequency components (spectrum), the FFT analyzer is also called a frequency analyzer or spectrum analyzer.
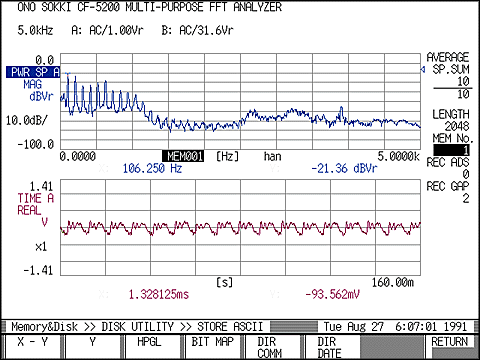
For example, an analysis of the sound "A"(pronounced as "aah") using an FFT analyzer produces the spectral waveforms in Figure 1-1, which indicate the sound waveform's frequency f along the X-axis and amplitude r along the Y-axis. These spectral waveforms indicate that the sound of "A" is composed of waves whose frequencies are f1, f2, f3.....,fn, and their amplitudes are r1,r2,r3,......,rn. Stated another way, this graph represents a combination of waves whose frequencies are f1,f2,f3......,fn, and their amplitudes are r1,r2,r3,......,rn,which compose together to form the sound waveform of "A".
Figure 1-2 shows the time-base waveforms actually measured and their spectrum of sound "A". The lower graph shows the time-base waveforms and the upper graph indicates the spectral waveforms. Frequencies appearing as peaks in the left part of the spectral waveforms correspond to f1,f2,f3,....,fn.
Now let's consider FFT for more tangible examples.

Figure 1-2
|
Figure 1-3
Why use an FFT analyzer for frequency analysis (i.e., observe the frequency of waveforms)?
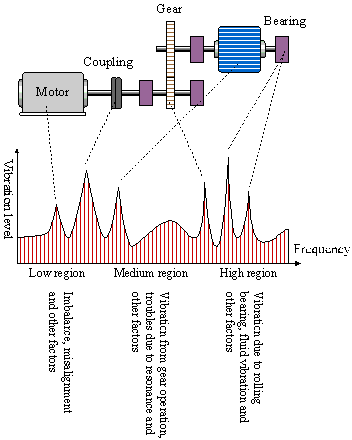
The composite waveform shown in Figure 1-3 can be regarded as a combined waveform obtained from the vibrations at each position of the machine (see figure 1-4).
Figure 1-5 is a conceptual diagram showing the relationship between the result of the analysis of the composite vibration waveforms from this rotary machine obtained using an FFT analyzer and the positions of the sources of vibration.

Figure 1-5
The frequencies corresponding to the vibration generated from each position are determined from the construction of the machine. In the past, when maintaining and controlling facilities and diagnosing anomalies, a measure of the entire vibration was obtained, that is, an overall value was measured with a vibration meter. However, as an overall value only discriminates whether the vibration is strong or weak, the actual location of the anomaly could not be identified.
By observing a waveform frequently using an oscilloscope (in the time domain), we could see the waveform change over time (time-axis waveforms) but it was difficult to determine the cause of that change. It was not possible to estimate the cause of the anomaly and the abnormal positions until frequency analysis data obtained using FFT enabled us to investigate the degree of change that occurred at what level of frequency and the frequencies generated from a particular position. In the early stages of failure or for slight anomalies, the overall value of time-axis waveforms shows very little change, making the failure/anomaly very difficult to detect. Frequency analysis (observing the waveform in the frequency domain) makes detection of even slight anomalies possible.
In addition to facility control and failure diagnosis using vibration analyses, frequency analysis is now used in various other fields, such as for the evaluation of quietness and noise analysis of office equipment and home electric appliances, to investigate the cause of noise and possible countermeasures.
2.Representation of Waveforms (Sine wave and Cosine wave)
To understand the meaning of the data given by an FFT analyzer, it is necessary to understand the concept of Fourier series -- the fundamentals of FFT and its mathematical background. This chapter explains the representation of sound as waveforms, which is necessary for understanding the Fourier series and the characteristics of the sine wave and cosine wave.2-1 Amplitude, Phase and Frequency
A waveform can be represented with three different parameters: amplitude, frequency (or period) and phase (or time-difference).Amplitude
The amplitude shows the magnitude of the waveform. Taking sound as an example, a loud sound has a large amplitude.|
|
Figure 2-1
Frequency
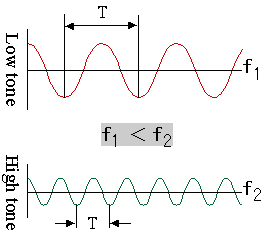
The frequency represents the number of wave periods repeated in one second and is defined in units of Hz. The following relationship applies, where frequency is represented by f and the period by T.
| |
(Equation 2-1) |
In respect to sound, it is recognized that high frequency waveforms correspond to high tones and low frequency waveforms to low tones.
 |
Figure 2-2
Phase
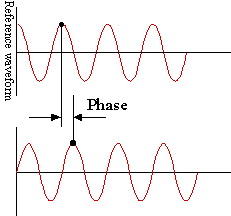
One period of a wave is represented as an electrical angle of 360º or 2p radians. "Degree" is used for explanation purposes, but in mathematical expressions, "radian" is generally used and expressed simply as "rad". The position of a peak, if measured at a particular point in time, may differ even between waves of the same frequency. The difference in the peak position of a given waveform from the reference waveform is usually expressed as a quantity called a "phase difference." The phase is considered "negative" if the particular peak lags behind the corresponding peak in the reference waveform, or "positive" if it comes after the corresponding peak.
 |
Figure 2-3
|
Figure 2-4
In Figure 2-4, the waveform obtained by the locus of the shadow of the ball projected on the Y-axis represents a sine wave and the waveform obtained by the locus of the shadow of the ball projected on the X-axis represents a cosine wave. The length of the string (r) corresponds to the amplitude, and the time taken for one full rotation of the ball to the period (T). If the angle of one rotation of the ball is expressed in radians, 360°=2p radians, and the angle rotated through by the ball in t time can be calculated from equation 2-2,
|
(Equation 2-2) |
where the frequency f indicates the number of rotations the ball makes in one second, and is given by the equation 2-3,
|
(Equation 2-3) |
Then, the loci of each shadow after t time are expressed in the following mathematical equations.
|
(Equation 2-4) |
These two equations show the position of the ball after t time as X-Y coordinates (x,y).
Now, if we assume that the ball at the position achieved by angle f as shown in Figure 2-5, then equations 2-4 obtain the following:
|
Figure 2-5
|
(Equation 2-5) |
Since a, b, and r can be regarded as the three sides of a right-angled triangle, the following equation also holds.
|
(Equation 2-6) |
As seen above, the ball position is specifically determined by either using a and b in equations 2-5 or using r and f, regardless of the number of rotations of the ball.
There are many physical phenomena that exhibit periodicity and are therefore classified as wave phenomena. The sine and cosine function are used together with the tangent function as trigonometric functions in the mathematical expressions that explain such phenomena.
Let's assume that the position of angle f is the starting point (in this case, f represents the initial phase). Then, equation 2-4 can be expressed as shown below.
|
(Equation 2-7) |
|
(Equation 2-8) |
The expression representing the locus of ball motion may either be equation 2-7 or equation 2-8. Equation 2-7, the cosine-based function, is generally used, however, because a sine wave is considered to be a cosine wave with a phase lag of p/2 and formulas representing physical phenomena are often expressed using cosine-based functions for ease when solving.
The next section explains the related waveform expressions and the important common terms of FFT waveform analysis.
If a person screams out towards a mountain, an echo will be heard a short time after. Let's consider how the time-difference between the time of the scream and the time of echo return is expressed as the phase difference.
If the period of the waveform is represented by T, the frequency by f, time difference by t and phase by f, then:
|
(Equation 2-9) |
For example, in the previous waveform of the "A" sound, if the frequency of "A" was 106 Hz and the time-difference to the echo return t=0.001 second, then the phase is calculated to have a lag of approximately 0.21p=38.1º. If the time difference is the same, t= 0.001 second and the frequency of "A2" is assumed to be 212 Hz, then a phase lag of 76.3º occurs. This shows that if period T (frequency) is different, then the phase will also be different, even if the time difference is the same.
2-4 Electrical Angle and Mechanical Angle
Besides amplitude, frequency, and phase, it is also important that the difference between the electrical angle be understood.
Assume that an electroMagnetic Detector is prepared for a gear having 60 teeth and the gear rotates at 600 r/min. If the gear rotates one full revolution, a 60-cycle sine wave signal is output from the electroMagnetic Detector. Here, the phase expressed by taking one period of the signal sine wave as 2p rad (360º) is called an "electrical angle" and the phase expressed by taking one rotation of the gear as 2p rad is called a "mechanical angle."
|
Figure 2-6
As shown in Figure 2-6,
the frequency of the signal sine wave, f = 600r/min./60s×60 gear teeth = 600(Hz), and
the frequency of rotation of the gear, f0 = 600r/min./60s = 10(Hz).
Although one period of the signal sine wave and that of the gear both have an angle of 2prad, their time differs as shown below:
Period of the detector signal = Period of electrical angle expression = 2p = 1/600 second
Period of one turn of gear = Period of mechanical angle expression = 2p = 1/10 second
The electrical angle is based on one period of electrical signals, while the mechanical angle is based on one period of one revolution of a body. When the phenomena of rotating bodies are analyzed, the frequency analysis data must be considered in light of the relationship between the electrical and mechanical angles.
An FFT analyzer uses electrical angles.
The rpm order is frequently used to analyze phenomena related to revolutions. If the gear rotation described above is considered as a reference frequency, the sine-wave signal has a frequency of 60 times the reference frequency of the gear. This is called the "sixtieth harmonic." In rotary machines, among other things, the term "rotation" is used to note the rotational frequency (revolutions per second) of the gear. For example, rotation at a frequency of 10Hz is referred to as the 1st-order rotation and rotation based on a 600-Hz sine-wave signal is referred to as the 60th-order rotation.
The term, harmonics, refers to the frequencies of integer multiples of the fundamental frequency. For example, if the frequency of fundamental wave "A1" of sound "A" is 106 Hz, then the frequency of its second harmonic "A2" is 212Hz. These days, harmonic distortion analysis is carried out on the frequency of power supplies. This involves analyzing the integer multiples of harmonic components or the amplitudes and phases of these frequencies, when the fundamental power frequency is say 50 or 60 Hz.
2-6 Representation of Waveforms (Sum of Waveform (composition))
Consider the sum of the waves shown below (composition of waves).
|
(Equations 2-10) |
The composite waveforms are as shown in (3) and (4) of Figure 2-7, each having the same frequency but different amplitude and phase.
Let's consider x2 first. The equation of x2 can be rewritten as shown below using the trigonometric formula.
|
(Equation 2-11) |
This means that, if a cosine wave and a sine wave having the same frequency and phase are composed, then the resultant wave is equal to a cosine wave having root 2 times the original amplitude and a phase lag of p/4. This can also be expanded as shown below.
|
(Equation 2-12) |
If the "a" coefficient of the cosine wave is taken on the cosine axis and the "b" coefficient of the sine wave is taken on the sine axis, then Figure 2-9 is obtained. As this figure is the same as the previous Figure 2-5, equations 2-6 can be solved as follows.
|
Figure 2-8
|
(Equation 2-13) |
That is, equations 2-14 hold true.
|
(Equation 2-14) |
As seen above, a waveform with a single frequency (hereafter called a simple waveform) can be expressed as an equation having the same frequency and coefficients of a and b as shown below.
![]()
Thus, if coefficients a and b are given, composite amplitude value r and phase difference can be determined.
For example, if the coefficients of the equation of the composite waveform,x1=![]() , are a=2 and b=0, then the value of composite amplitude r=2 and phase difference f=0.
, are a=2 and b=0, then the value of composite amplitude r=2 and phase difference f=0.
Components "A?", "A2", "A3",... of the sound "A" that was frequency-analyzed, are each simple waveforms that can be expressed in the form ![]() . For your reference, please note that phase difference f is
. For your reference, please note that phase difference f is ![]() .
.
2-7 Representation of Waveforms (Product of waveforms)
Now that we have explained how simple waveforms can be represented by the expression "![]() ," this section will explain how the coefficients of the expression are actually determined.
," this section will explain how the coefficients of the expression are actually determined.
Let's consider the following products of waveforms.
|
(Equations 2-15) |
Figure 2-9 shows waveforms of the following expressions when a1=2, a2=3, and b=2.
As shown in this figure, the product of periodical waveforms results in a waveform also having periodicity.
Let's consider the area obtained by integrating the waveform of x1 for one period (from 0 to 2p).
In waveform x1, the area on the positive side ![]() and the area on the negative side
and the area on the negative side ![]() are equal, this the sum of the areas is zero. Waveform X2 expresses the product of the fundamental waveform and the second harmonic component. The area of waveform X2 is also zero. However, for the waveform of X3, there is no negative side area, and the sum of the area.
are equal, this the sum of the areas is zero. Waveform X2 expresses the product of the fundamental waveform and the second harmonic component. The area of waveform X2 is also zero. However, for the waveform of X3, there is no negative side area, and the sum of the area.
That is,
|
(Equation 2-16) |
This means that amplitude an can be determined from an arbitrary waveform of the form ![]() ," where n=1,2,3,...,by:
," where n=1,2,3,...,by:
* multiplying the waveform by ![]() in order to determine the area for one period,
in order to determine the area for one period,
* dividing the area obtained by T/2, and then
* extracting the original ![]() component.
component.
Similarly, if the above arbitrary waveform is multiplied by ![]() , the area of the product waveform determined and then divided by T/2, then amplitude bn can be determined.
, the area of the product waveform determined and then divided by T/2, then amplitude bn can be determined.
This report contains a conceptual explanation of FFT and the fundamentals of sine and cosine waves necessary for understanding Fourier transform and Fourier series. Within this explanation, appear many mathematical expressions. Did you understand them? We have tried to give these mathematical expressions meaning by showing them with real figures. If you have any questions, please feel free to discuss them with us.