Complicated graphs such as multi-axis graph, contour map and so on can be created easily by using drawing software.
OC-1000 helps us to create the wide variety of the graphs quickly such as complicated multi-axis graph, contour map and so on, which are required on site for the study and research & development.
As we can create original templates easily, the report can be created smoothly. Everybody can obtain the required graph immediately by the easy operation.
Features
Wide variety of graph creation functions such as multi-axis graph, contour map, 3D graph etc
-
Complicated graph, which is required at the every scene of research & development, can be created with high quality and speedy
Available graphs
|
|
■ Scatter plot |
■ Line plot |
|
■ Bar chart |
■ Contour map |
|
■ Curve chart (Spline, Semi-Hermitian Regression) |
■ Grouping graph |
|
■ 3D wire frame etc |
|
Supplementary graph creation functions |
|
■Parameter searching |
■ Overlaid function etc. |
|
High quality 3D graph by using OpenGL®
-
High quality 3D graph is created by using OpenGL® with high performance visual function. View point and size of the graph can be changed easily by only dragging the mouse.
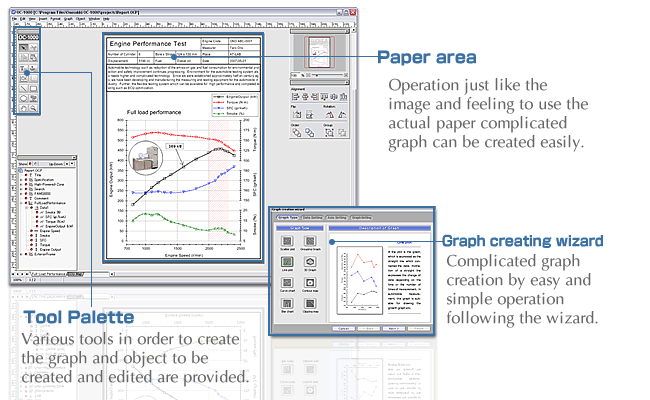
Easy operation such as drawing software feeling
-
Complicated layout and templates, which mix the multi-axis graph and contour map, can be created easily. Automatic creation of the report can be possible by using the original templates.
Graph creation wizard makes it simple for the complicated setting
-
Graph creation can be done easily by the easy operation of the wizard. Normally multi-axis graph, 3D graph, contour map which needs the complicated setting, but here it can be created smoothly.
ASCII, EXCEL, DS-2000 data can be captured as OC-1000 graph data with a one-click operation.
|
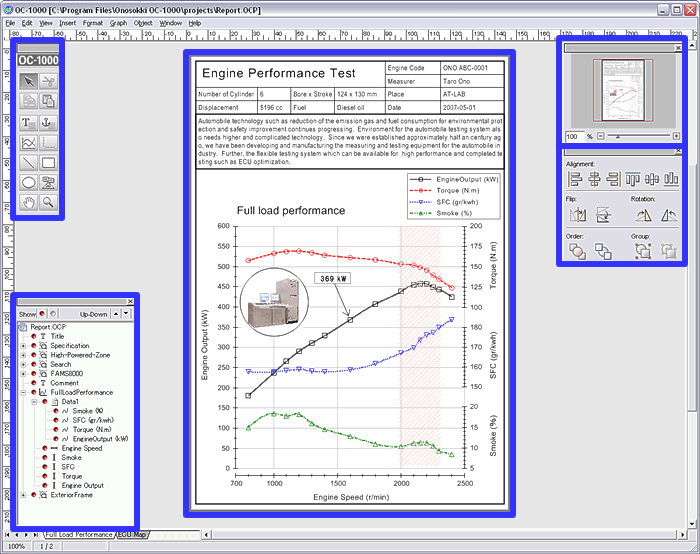
Example for the report with graph data by OC-1000 |
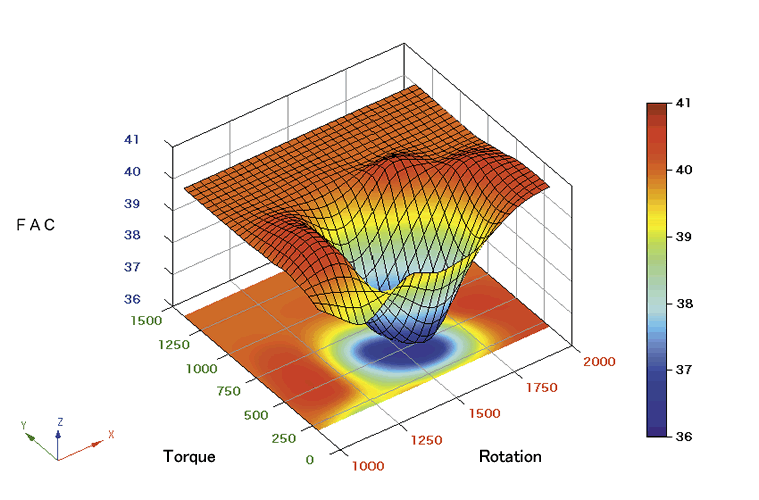
Example for report of engine performance test: multi-axis graph
|
↑
By clicking each one, displaying detailed screen . Click the right half to go next screen, left half to move previous screen.↓ |
■OpenGL®
The 3D graph viewer of the OC-1000 allows an excellent visual performance and draws high-quality 3D graphs using OpenGL® |
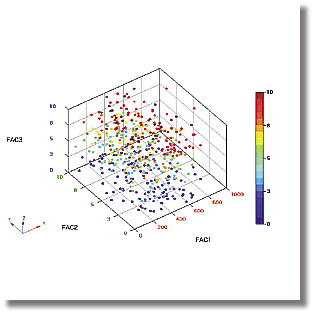
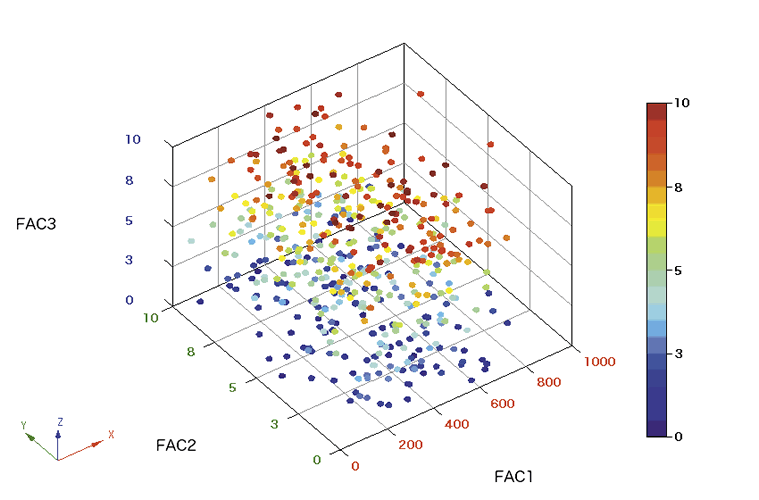
■3D Scatter plot
3D scatter plot which represents distribution sterically can be drawn as a type of full-scale 3D graph using OpenGL® |
|
 |
 |
| |
|
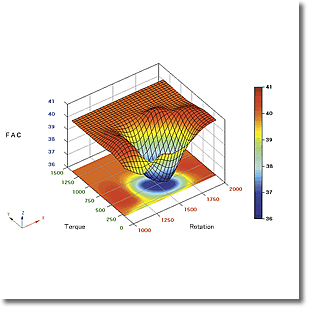
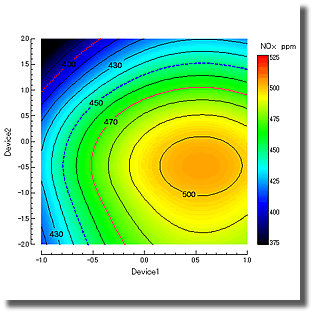
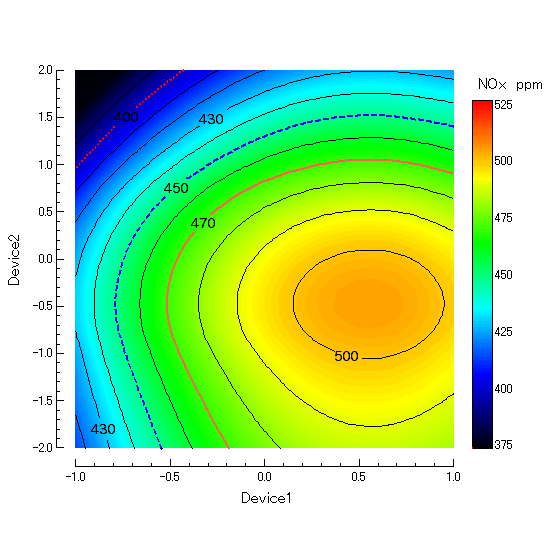
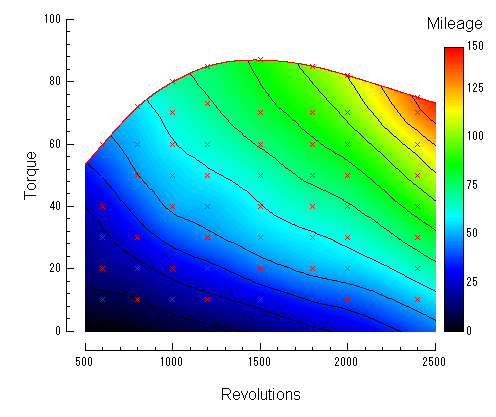
■Contour map
The OC-1000 allows you to create contour map, which is convenient to draw ECU map image etc., with easy operations.
Also it can change settings freely in contour level, fill attribute to ON or OFF, and so on. |
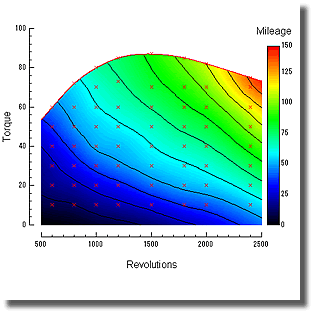
■ Clipping map
The clipping map is a graph which clips the contour map with lines connecting maximum Y-axis values. It can also clip the contour map which is suitable for the equal fuel efficiency curve chart with full-load curve function. |
|
 |
 |
| |
|
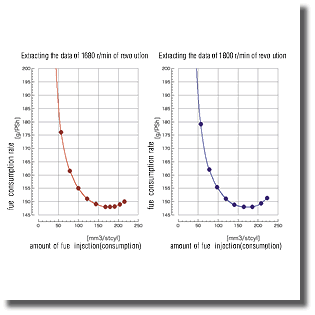
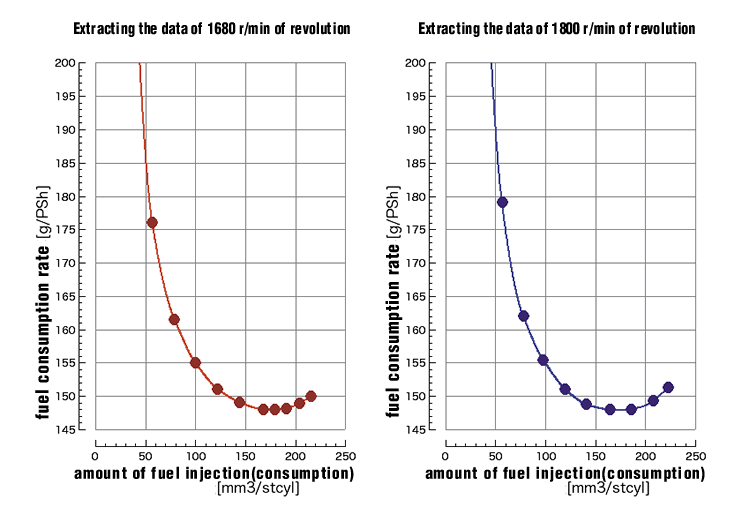
■Search function by parameter
You can select only the required parameter values from specified item data to extract the target data for direct graph creation. |
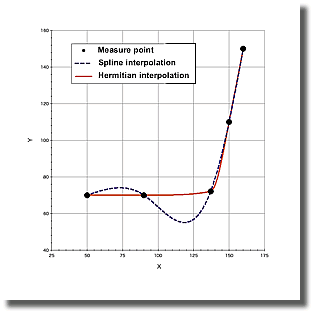
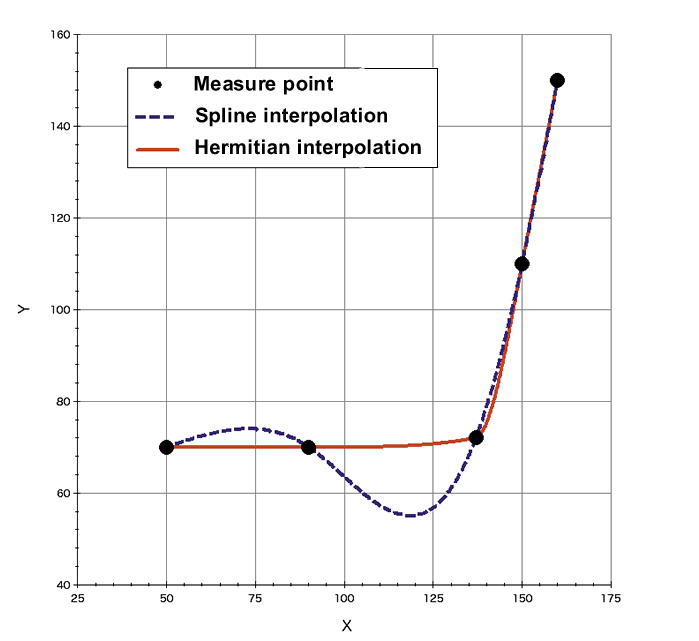
■Hermitian interpolation
You can create graphs with Semi-Hermitian interpolation with less number of measuring points than signal processing tests etc., which is suitable for automotive tests. It is characterized by the fact that unnatural vibration hardly occur and more smoothly than spline interpolation and so on. The OC-1000 also has conventional functions such as 3rd spline interpolation, B spline interpolation as standard functions. |
|  |
 |
Basic Specifications
| Item |
Specifications |
Remarks |
| Data import capacity |
Number of files: Up to 10 files |
Up to 10 million points with (Number of files x Number of data rows x Number of data lines) |
| Number of data rows: Up to 1024 rows |
| Number of data lines: Up to one hundred thousand lines |
| Data import formats |
Microsoft® Excel workbook
®Microsoft Excel version 97 or later(sold separated) needs to be installed in the personal computer used.) |
*.xls |
| Comma-separated forma |
*.csv |
| Tab-separated format |
*.tsv |
| Text file format(ASCII) |
*.txt |
| DS/CF series data file (Refer to the following DAT format Application Table for details.) |
*.dat |
| Picture image export formats |
Bitmap format |
*.bmp |
| JPEG format |
*.jpg |
| Meta file format |
*.emf |
| Web file format |
*.html |
| Graph types |
Scatter plot |
Multi-axis graph |
| Line plot |
| Curve chart (3rd order spline, B spline, semi-Hermitian, Regression) |
| Grouping graph |
| Bar chart |
| Contour map |
Colored/Colorless/Fill/No fill |
| Clipping map |
| 3D scatter plot |
| 3D wire-frame graph |
| 3D contour map |
| 3D bar chart |
Options
| Name |
Overview |
| Digital map |
Allows you to calculate the Z-axis value at the position of specified mesh value (X/Y-axis value) based on contour maps or 3D data of 3D graphs and then store the result in file. |
Operating Environment
| Item |
Specifications |
Remarks |
| OS |
Microsoft Windows®2000,Windows®XP |
- |
| CPU |
Intel® Pentium®III 500 MHz or higher |
- |
| Memory |
256 MB or more |
|
| Hard disk |
200 MB or more |
- |
| Display resolution |
1024 x 768 or higher |
1280 x 1024 recommended |
*OC-1000 is registered trademark or trademark of Ono Sokki., Ltd. in Japan.
*Windows® 2000,Windows® XP, Microsoft® Excel are registered trademark or trademark of Microsoft Corporation in the United States and other countries.
*Intel® Pentium®are registered trademark of Intel Corporation in the United States and other countries.
*OpenGL® is registered trademark of Silicon Graphics, Inc. in the United States.
Revised: 2008/07/31
Outer appearance and specifications are subject to change without prior notice. |
