If frequency resolution is expressed by Δf , the relationship is (1)based on the equation in ‘What is the Relationship between the Time Window Length and the Number of Sampling Points?’ in the FFT Analyzer Basic FAQ.
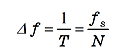 |
(1) |
Thus, in order to increase the frequency resolution (i.e. reduce Δf ), the time window length must be increased. This is achieved by either reducing fs, or increasing the number of sampling points N. Since setting the analysis frequency range automatically results in setting of the sampling frequency, in practice, the frequency resolution is dependent primarily on the number of sampling points N.
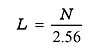
An FFT with N sampling points obtains a frequency spectrum of N/2 points, and an N/2.56 (the number of analysis lines L) frequency spectrum in the analysis frequency range. In other words, the relationship between the number of analysis lines L and N is (2) as in the ‘
What is the Relationship between the Frequency Range and the
Sampling Frequency?’ in the FFT Analyzer Basic FAQ.
 |
(2) |
Cautions for frequency resolution are as follows.
The time resolution must be increased (and the time window length reduced) in order to view instantaneous time variations in the spectrum, with a consequent deterioration in frequency resolution (see equation (1)). Thus, the spectrum time resolution and the frequency resolution are inversely related in normal FFT analysis.
When analyzing random signals from limited time signal data, and computing and estimating PSD (power spectrum density), increasing the time window length does not result in an improvement in statistical accuracy, and frequency resolution increases without other effects. When only limited time data is available, it is desirable to reduce the time window length and increase the mean number of cycles for estimation of the PSD, even if reducing the frequency resolution slightly.
In conclusion, the relationship between time and frequency axes, and the number of sampling points, is as follows.
1. Analysis frequency range is determined by sampling frequency (frange = fs/2.56).
2. The number of analysis lines is determined by number of sampling points (L = N/2.56).
3. The time window length is determined by sampling frequency and the number of analysis lines (T = N/fs)
4. The frequency resolution is determined by time window length. (Δf = 1/T)