![]()
![]()
![]()


The followings are diagrams of the relation of data length, frequency range, frequency resolution, and display length of time waveform.
| Data length | Diagram 1 16384, 8192, 4096 points |
Diagram 2 2048, 1024 points |
Diagram 3 512, 256, 128 points |
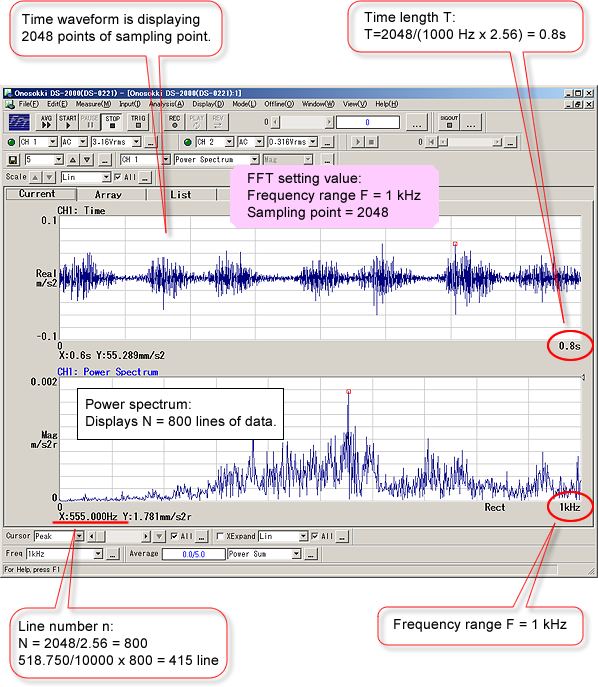
The sampling points of nth power of 2 are treated as one frame of data in FFT analyzer of CF series and DS series. Therefore, one frame of data is displayed in the FFT analyzer screen. When the time-axis waveform is selected, the data of for example "2048 sampling points" are displayed.
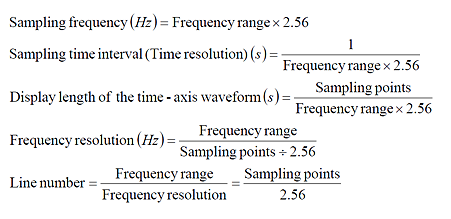
When the power spectrum display is selected, the number of line data which is from 0 Hz to selected frequency range is displayed. The "Frequency range" and "Sampling point" are set in the FFT analyzer to determine the "Frequency resolution" and line number is determined as an inverse number of the frequency resolution. In power spectrum display, the line numbers of data are displayed at every steps of frequency resolution. For these relationships, please refer to the following formula;
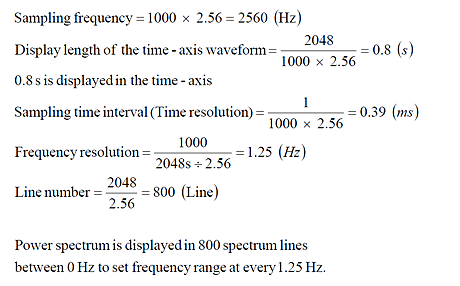
(Example) Frequency range: 1 kHz (1000 Hz), Sampling points: 2048
|
 |
Revised:2002/06/17