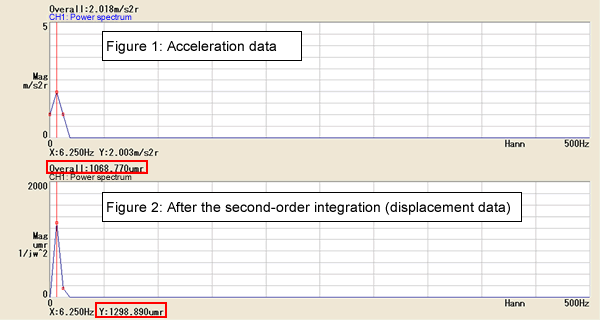

This phenomenon is occurred by the influence of the window correction. Generally, there is influence component by the window in both sides of the selected frequency components of frequency spectrum. To correct this influence, a fixed coefficient is multiplied while calculating the overall value. Same correction is performed in the frequency calculus, so same phenomenon is occurred.
<Reference example>
 |
[Figure 1]
If there is amplitude in 6.25 Hz which is next to 0 Hz, the amplitude value is also appeared in 0 Hz or 12.5 Hz due to the influence of the time window. Also, if there is amplitude in 0 Hz, the amplitude value is appeared in 12.5 Hz as well. (The amplitude is occurred when the fluctuation or residual offset is occurred.)
If it is hanning window, overall value can be obtained by dividing total power value of all frequency data by 1.5. (This coefficient "1.5" is called "Equivalent noise band width".)
[Figure 2]
When operate the integration, integration value of 0 Hz cannot be defined, so contents of 0 Hz are forcibly set as "0". At this time, leakage amount of 6.25 Hz is also set as 0, so the overall value which is divided by 1.5 becomes smaller than peak value.
The influence of low frequency component appears significantly in the integration process, so the frequency components which is smaller than the resolution of FFT analyzer becomes indeterminate. We recommended you to use the partial overall which specifies the frequency band width (Approx. 3 Hz or more) against to the integration results.
Revised:2014/06/20