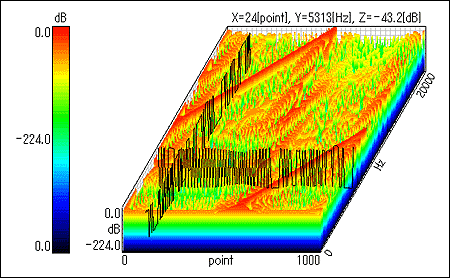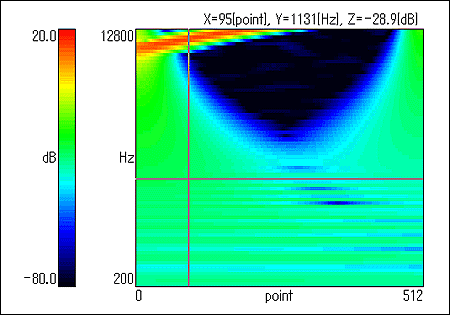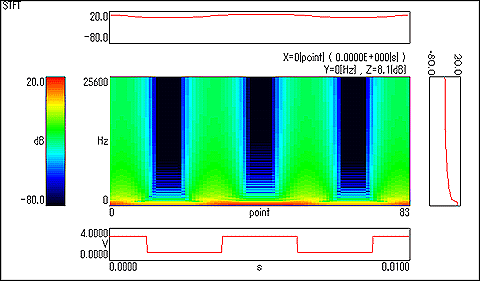

DS-0230 time-frequency analysis software executes arithmetic processing such as short-time Fourier transform and Wavelet transform, and Wigner distribution analysis for temporal axis data (file extension: data/.prm) that has been logged by the software of DS-2000 and Ono Sokki’s FFT analyzer (CF-6400/CF-5000/CF-4200 Series, and so on).
Item |
Wigner distribution |
Wavelet transform |
STFT |
|---|---|---|---|
| Time resolution | High | High frequency : High Low frequency : Low |
Constant |
| Frequency resolution | High | High frequency : Low Low frequency : High |
Constant |
| Feature | The resolution is high up to the limit that is physically allowed. | Well-balanced time and frequency resolutions. | Stable results can be obtained by the extension of FFT. |
| Problem | Existence of cross terms Negative energy | Only an appropriate frequency is available. | Both the time resolution and frequency resolution are moderate. |
| Application example | Vibration analysis of abnormality of a rotating drum of a copy machine | Voice analysis and image communication fields | Normal time and frequency analysis |
Wigner distribution
Wigner distribution is an analysis technique that enables simultaneous analysis of time fluctuation and spatial transition of complicated waveforms such as sudden or non-stationary sound or vibration. Wigner distribution, which was advocated by E.Wigner in 1932 in the quantum mechanical field, has subsequently been applied to sound analysis by T.Classen and W.Mechlenbraker and the technique has attracted much attention as the analysis method for non-stationary signals. Since Wiger distribution that has energy dimension demonstrates the highest time and frequency resolutions, the technique can capture the features of transient signals better than the existing technique. However, since negative energy and cross terms frequently appear, expertise is necessary for the interpretation. By using time and frequency distribution function, this method is expected to become an effective tool for analysis of transient characteristics of impulsive sound, abnormal sound, and acoustic equipment.

| Time axis resolution | 200 points |
|---|---|
| Frequency resolution | 256 points (of which 200 points are displayed.) |
| Length of lag window | Any number of points between 1 point and 257 points (odd number) can be set. |
| Analysis time frame length | Up to 16384 points |
| 3-D display | 3-D display by the colors (64 colors) of amplitude (dB) |
| Data read | By search point |
| Display of cross section | Display of cross section by the search cursor |
Wavelet transform
Wavelet transform is continuously developing new analysis technique that enables simultaneous analysis of time fluctuation and spatial transition of complicated waveforms such as sudden or non-stationary sound or vibration. Since the initial introduction of analysis by Wavelet transform as a tool for analyzing artificial seismic waves by oil exploration engineers, the technique has been applied to various fields from mathematical formulation by the efforts of physicists, mathematicians, and engineers. As indicated by the name, Wavelet (localized small waves), Wavelet transform uses a set of functions that can be obtained by functioning scale transform and shift transform for a localized function (practically) in terms of both time and frequency as sown mathematically. Since the technique is a natural analysis technique that uses long-time data in low frequency (slow fluctuation) and short-time data in high frequency (quick fluctuation), this technique is attracting much attention as the analysis technique for various transient phenomena. Distribution of absolute square value of the Wavelet transform result is referred to as scaleogram. Wavelet transform of DS-0230 time-frequency analysis software can display signal spectrum through a 2-D color image or a 3-D color image on the flat surface of time-frequency.

| Mother wavelet | Gabor function |
|---|---|
| Time axis resolution | 200 points |
| Frequency resolution | 256 points (of which 200 points are displayed.) |
| Length of lag window | Any number of points between 1 point and 257 points (odd number) can be set. |
| Analysis time frame length | Up to 16384 points |
| 3-D display | 3-D display by the colors (64 colors) of amplitude (dB) |
| Data read | By search point |
| Display of cross section | Display of cross section by the search cursor |
STFT
STFT (Short Time Fourier Transform) refers to the process that extracts signals at each short time and applies Fourier transform to capture the time fluctuation of frequency components of non-stationary signals. Short time Fourier transform is the simplest and most user-friendly technique for analysis of non-stationary signals. In general, in FFT, to improve the precision (time resolution) for time fluctuation, the extraction time needs to be reduced and the precision (frequency resolution) for the frequency deteriorates correspondingly. Therefore, in STFT, a measure is taken to improve the time resolution while maintaining the necessary frequency resolution by setting the extraction time window and the length of Fourier transform separately. The distribution of absolute square values of short-time Fourier transform result is referred to as spectrogram.

| Time axis resolution | Up to 8192 points |
|---|---|
| Frequency resolution | Up to 2048 points |
| Analysis time frame length | Up to 16384 points |
| FFT frame length | Up to 4096 points |
| 3-D display | 3-D display by the colors (64 colors) of amplitude (dB) |
| Data read | By search point |
| Display of cross section | Display of cross section by the search cursor |
Revised:2009/11/16