The accelerometer was set in the vibration calibrator, and sensor output was input to the DR-7100. Seeing from the sensitivity value, the signal must be about 1/10 compared with the input voltage range but the bar graph has expanded more than half in the graph.Is the output from the sensor a correct value?
The bar chart of the DR-7100 is displayed in decibels, and -60dB from the maximum value is displayed. Because the signal of 1/10 compared with the input range is -20dB compared with the maximum value, the bar chart is expanded to about 2/3 of the display area. Therefore, it can be said that the displayed value is not wrong.
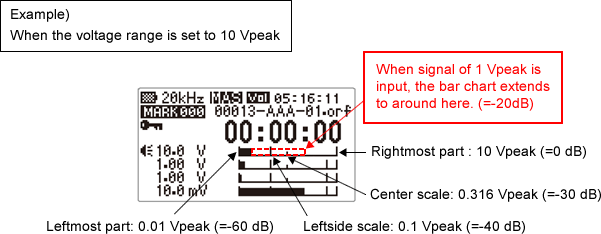
1. Rightmost of the bar chart shows 10Vpeak (upper limit of the range), 0 dB.
2. A scale is marked on a place of one-third from the leftmost of the bar chart. It is -40 dB. When signal which is a 1/100 of the voltage range is input, the bar chart comes to this position (the place of one-third from the leftmost).
3. Small scale is marked on the center of the bar chart. It is -30 dB. Set an appropriate input range based on the bar chart during data recording.
When signal which is a 1/10 of the voltage range is input, the bar chart comes to the place of two-third from the leftmost of the bar chart. (It looks larger in a bar chart.)