No.6 Measurement of frequency response function using sine sweep signals output from external system - part 1
In this column, I will introduce measurement of frequency response function using sine sweep signals output from external system such as a controller of exciter. With this method, the frequency of the sine wave will change regardless of FFT calculation of an analyzer, thus if the sine wave sweep speed is too fast, correct results will not be obtained. Moreover, this method is not suitable for measuring accurate amplitude.
●Measuring frequency response function using sine sweep signals output from external system
The Figure 1 shows the system configuration example.
A sine sweep signal is output from the controller with an oscillator to vibrate the exciter. Attach the accelerometers to the exciter and the measurement target respectively, and the frequency response function (natural frequency) of the measurement target is obtained from these signals.
The channel connected to the accelerometer attached to the exciter is the reference channel for sine sweep. The analyzer detects the frequency of the vibration currently input from the signal input to the reference channel, and calculates the frequency response function at that frequency. Since the sine sweep signal is output from the controller, the frequency response function at each frequency can be measured by repeating the FFT operation.
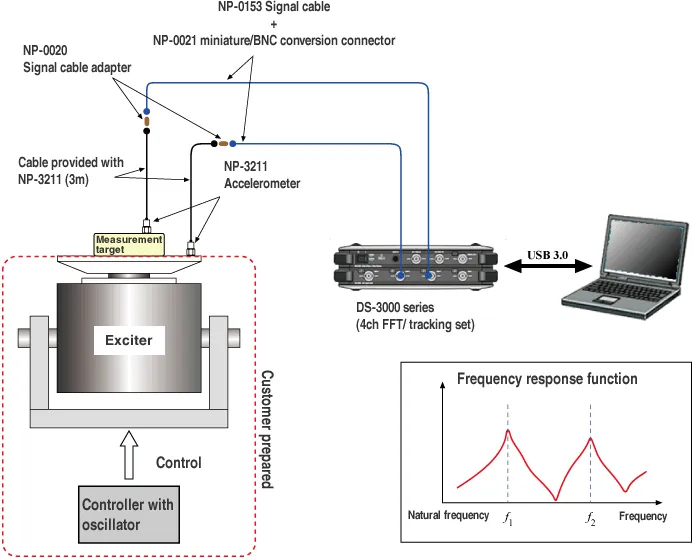
Fig.1 System configuration example
●Setting items for the measurement of frequency response function using the signals output from external systemThe frequency step (frequency resolution) of the measured frequency response function is determined by the combination of the frequency range and the number of sampling points as shown in the following equation. Set the frequency resolution in the combination of the frequency range that you want to measure and the number of sampling points.
Number of lines= Sampling points ÷ 2.56
Frequency resolution [Hz]= Frequency range [Hz] ÷ Number of lines
The following are standard setting items for the measurement of frequency response function using the DS-0321 FFT analysis software of the DS-3000 series. Other FFT analysis software and FFT analyzers also have different names, but similar settings.
●Input/ Output setting
●Configuration setting
Make sure that the channels used for measurement turn "ON".
Note that you cannot change the channel settings used in the graph or other.
●Cross operation CH setting
Confirm if the channels for measuring the frequency response function are registered.
●Frequency range
Set the frequency range.
●Input setting
Turn off the “Auto-range”. Adjust the voltage range according to the magnitude of the input signal. If the input-over occurs even once during measurement, increase the voltage range.
Set the coupling to "AC".
If you are connecting a sensor that requires a constant current power supply, such as an accelerometer or microphone, set CCLD to “ON”.
●Sampling condition setting
Set to “Internal”, set “Overlap amount” to “Max”, and set “Sampling points”.
●Unit calibration
Set according to the signal or sensor connected to each channel.
●Window function setting
Set to “Hanning”.
●Time-axis pre-processing
The “DC cancellation” turns “ON” each channel, while others turn “OFF”.
●Averaging processing setting
Set to “Power SP sweep”.
Set Averaging condition to “Count”, but the number of count will be ignored.
Turn OFF “Sweep synchronized with signal output”.
As for the sweep channel, set the channel to be the reference channel.
●Graph window
Display graphs such as the power spectrum, frequency response function accordingly. The graph of the power spectrum and frequency response function shows the result measured by the sine sweep signal. While, since the signal input at that moment is displayed on the time axis waveform and Fourier spectrum graph, those graphs can be used to monitor the signal input to the reference channel.
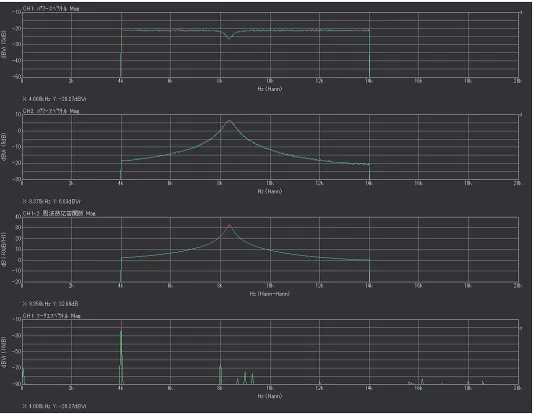
Fig.2 Measurement result of frequency response function
Since the input signal (CH.1) is 0.1 Vrms, the power spectrum value should be -20 dBVrms. However, in fact, it is less than -20 dBVrms and varies in the range between -20.5 and -21.3 dBVrms for each frequency.
In the FFT analysis using the Hanning window, accurate values will be obtained if the sine wave frequency is an integral multiple of the frequency resolution (25 Hz in this example). However, if the sine wave frequency deviates from an integral multiple of the resolution, the value will be smaller up to 1.42 dB.
Since the deviation of the frequency from an integral multiple differs depending on the timing when the FFT operation is performed. Thus, the value of the power spectrum will vary depending on the frequency.
If the sine sweep signal is swept too fast, the power spectrum value will be smaller, which I will explain in another column.
When the power spectrum value becomes smaller due to the above causes, the amount of the input signal (CH. 1) is equivalent to the amount of the output signal (CH. 2). Thus, they are canceled out, and the value will be correct when calculating frequency response function.
●Frequency response function measurement and the effect of sweep speed
Figures 3-1 and 3-2 show the measurement results frequency response function when the sweep speed of the sine sweep signal output from the function generator is changed. The frequency range is 20 kHz and the number of samples is 4096, so the frequency resolution is 12.5 Hz. The sine sweep signal has amplitude of 0.1 Vrms, frequency range of 4 kHz to 14 kHz, and the sweep time of 16 seconds and 64 seconds. The sweep speeds are 625 Hz/s and 156.25 Hz/s, respectively. The first row of the graph in each figure shows the power spectrum of the input signal (CH. 1) to the filter circuit, and the second row shows the frequency response function of the filter circuit.
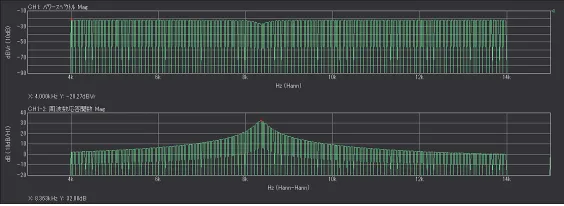
Fig.3-1 Measurement result (sweep time: 16 seconds, sweep speeds: 625 Hz/s)
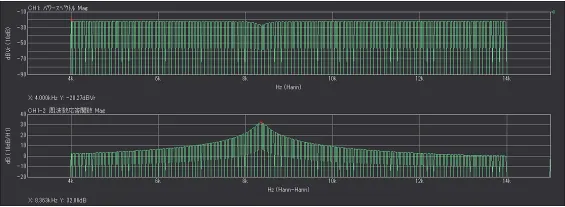
Fig.3-2 Measurement result (sweep time: 64 seconds, sweep speeds: 156.25 Hz/s)
In the figure 3-1, the component data of the frequency that could not be measured was missing in a comb-like shape since the sweep speed was too fast and the frequency of the sine wave changed by 12. 5 Hz or more before the end of one FFT operation. In the figure 3-2, the FFT operation was following up with the sweep speed, thus the phenomenon of comb-like shape does not occur.
●Standard sweep speed
With a frequency resolution of 12. 5 Hz, a single FFT operation requires a 0.08 seconds of time waveform. The ideal sweep speed is 12.5 Hz ÷ 0.08 s = (1.25 Hz) 2 = 156.25 Hz/s. If the sweep speed of the sine sweep signal from an external system is faster than this value, correct measurement results may not be obtained. The relationship between the frequency range, the sampling points, the FFT time length and the ideal sweep speed are as follows.
Number of lines= Sampling points ÷ 2.56
Frequency resolution [Hz]= Frequency range [Hz] ÷ Number of lines
FFT time length [sec]= 1 ÷ Frequency resolution [Hz]
Sweep speed [Hz/s]= Frequency resolution [Hz] ÷FFT time length [sec]
= (Frequency resolution [Hz])2
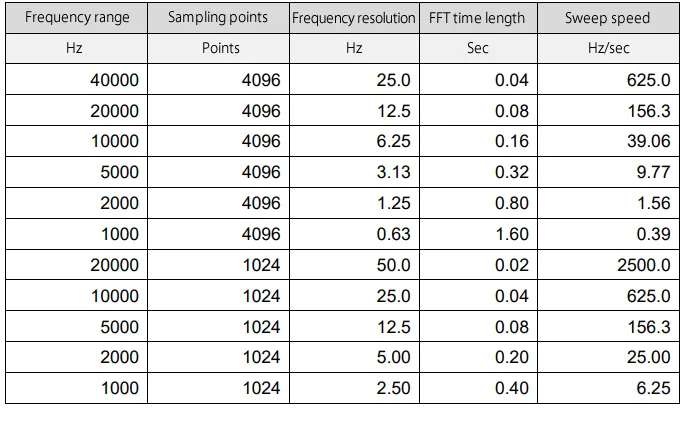
Table 1 Example of relation
If you're having trouble measuring the frequency response function, check the sweep speed, and if it's too fast compared to the ideal speed above, try slowing the sweep speed.
If you cannot change the sweep speed, reduce the sampling points.
For example, with frequency range of 2 kHz and sampling points of 4096, the frequency resolution is 1.25 Hz and the ideal sweep speed is 1.56 Hz/sec. It will take 640 seconds (less than 11 minutes) when sweeping for the 1 kHz range at this speed.
With 2048 sampling points, the frequency resolution is 2.5 Hz, the ideal sweep speed will be 6.25 Hz/sec, and the sweeping time will be 160 seconds.
With 1024 sampling points, the frequency resolution is 5.0 Hz, the ideal sweep speed will be 25 Hz/sec, and the sweeping time will be 40 seconds.
●Summary
This time, I have introduced how to measure the frequency response function using sine sweep signals output from an external system. In addition, I have introduced the phenomenon when the sweep speed is too fast, and the standard sweep speed. There are phenomena other than when the sweep speed is too fast. Therefore, I will introduce them in the next column.
(Y·K)