No.46 Lower range for measurable acceleration by Accelerometers
In the specification of accelerometer, there is no lower range for measurable acceleration indicated. It depends on the detector or analyzer noise, the measurement method, and the accuracy for the measurement result.
•Detector noise of accelerometer
The detector noise of the accelerometer with built-in preamplifier (voltage output type) is indicated in the product specification. Even if there is no vibration, the accelerometer outputs voltage signals (noises) corresponding to this value. Table 1 shows the sensitivity and detector noise of some of our accelerometers with built-in preamplifiers. Generally, a detector with higher sensitivity has lower detector noise converted to acceleration value.

If acceleration of 40 mm/s2 is input to the accelerometer with its detector noise of 0.004 m/s2 (rms) or less (equivalent to 4 mm/s2 (rms) of voltage signal), the output value will vary, with mean value of 40 mm/s2 and standard deviation of 4 mm/s2. We can simply say that the accuracy is 10%, however, the actual accuracy depends on the number of measurement times and the measurement method.
The charge output type accelerometer does not have detector noise in the product specification. The noise is determined by the input conversion noise level of the charge amplifier to which the accelerometer is connected. The input conversion noise level of our charge amplifier, CH-1200A is 0.05 pC (rms) or less. The detector noise converted to acceleration value is obtained from this value and the charge sensitivity of the accelerometer. Table 2 shows the sensitivities of some of our charge output accelerometers and the detector noise.

•Power spectrum of detector noise
Figure 1 shows the power spectral density (PSD) of the measured detector noise of the NP-3574, Tri-axial Accelerometer with built-in preamplifier. CH 1 (blue) is the X-axis of the NP-3574, CH 3 (red) is the Z-axis of the NP-3574, and CH 4 (green) is the value measured by short-circuiting the input terminal of the DS-3000 with 50 Ω resistor.
Using equipment: NP-3574, Tri-axial Accelerometer with built-in preamplifier and DS-3000 series Data Station
Measurement condition:
-Frequency range, 800 Hz
-Sampling points, 2048
-Voltage range, 10 mVrms
-Average time, 10 sec
-DC cancellation, ON
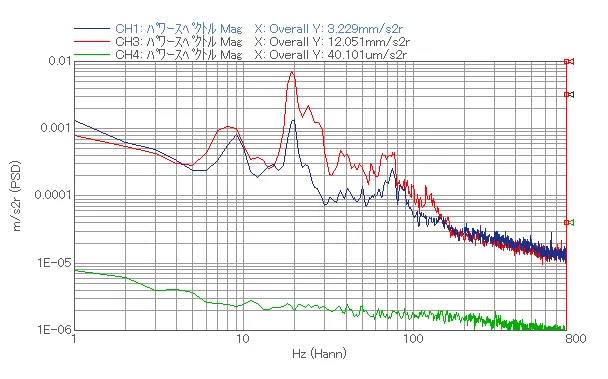
Fig.1 Power spectral density (PSD) of Tri-axial Accelerometer with built-in preamplifier
Since the measurement was performed in a general office, in addition to detector noise, the vibrations that seemed to be background vibrations were observed around 5 Hz to 80 Hz. The overall of CH 1 (NP-3574 X axis) is 3.229 mm/s2, which is less than the detector noise (4 mm/s2). The background vibration greater than the detector noise is observed at CH 3 (NP-3574 Z-axis). The CH 4 (DS-3000 self-noise) is about 1/100 of the detector noise, thus it does not affect the measurement.
This time, the voltage range of the DS-3000 was set to the lowest range of 10 mVrms for measurement. In this voltage range, the DS-3000's self-noise is small enough. If the voltage range remains the initial value (1 Vrms) or great, the self-noise of the DS-3000 will increase. Thus, detector noise, background vibration, and minute vibration cannot be measured. The voltage range must be set appropriately according to the magnitude of the actual vibration to be measured.
Also, DC cancellation was turned on. If 0 V is input to the analyzer, it should be displayed as 0 V, but there is slightly deviation. This deviation is called the residual offset voltage. Although the residual offset under this measurement condition is 0.14 mV (equivalent to 14 mm/s2) or less, it was removed by DC cancellation before measurement.
•Time-axis waveform of detector noise
Figure 2 shows the time-axis waveform of the detector noise for the NP-3574, Tri-axial Accelerometer with built-in preamplifier (X-axis).
Using equipment: NP-3574, Tri-axial Accelerometer with built-in preamplifier and DS-3000 series Data Station
Measurement condition:
-Frequency range, 8 kHz
-Voltage range, 10 mVrms
-Recording time, 10 sec
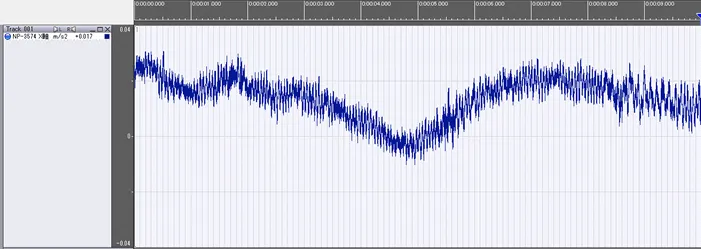
Fig.2 Time-axis waveform of the detector noise for the NP-3574, Tri-axial Accelerometer with built-in preamplifier (X-axis)
It seems that the time-axis waveform is shifted to the plus side by about 14 mm/s2 (0.14 mV) due to the residual offset (DC offset) of the DS-3000 Data station. The specification of the residual offset under the current measurement conditions is 0.14 mV (equivalent to 14 mm / s2) or less, which is almost the same as that value.
The time-axis waveform seems to wave gently due to the background vibration with low frequency.
•Reading the acceleration value from the time-axis waveform (1)
The time-axis waveform data of the detector noise for 10 seconds is divided into 10 (= 1 second of time-axis waveform data x 10), and a sine wave with frequency of 160 Hz and half amplitude of 40 m/s2 is applied to each of the divided data.
Table 3 shows the results of reading the maximum and minimum values for the one cycle of the first sine wave (62.5 ms) of time-axis waveform with 1-second length, dividing the difference by 2, and obtaining the half amplitude value.
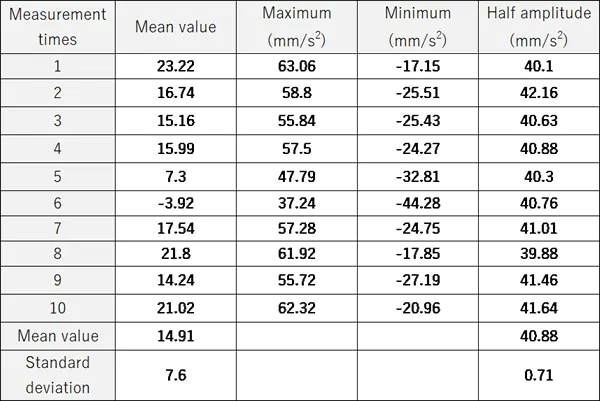
Table 3. Half amplitude of acceleration results from time-axis waveform for one cycle of sin wave
The mean value of 10 times measurement data is 40.88 mm/s2, the standard deviation is 0.71 m/s2. They looks fine.
The mean value varied in the range from -3.92 to 23.22 mm/s2, as shown in Table 3. This is caused by residual offset and background vibration on the analyzer.
•Reading the acceleration value from the time-axis waveform (2)
Table 4 shows the results of reading the maximum and minimum values of the entire time-axis waveform with 1-second length, dividing the difference by 2, and obtaining the half amplitude value.
Table 4. Half amplitude of acceleration results from the entire time-axis waveform
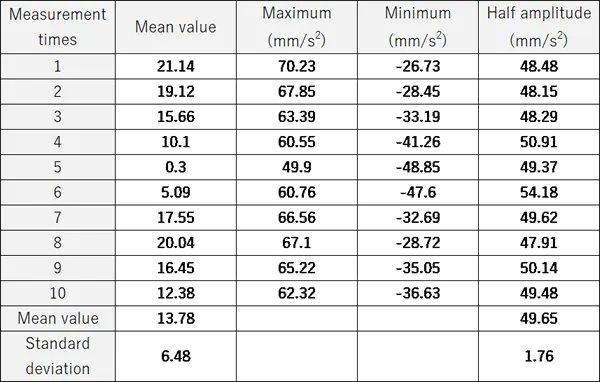
The mean value of 10 times measurement data is 49.65 mm/s2, the standard deviation is 1.76 m/s2. Since it is a 160 Hz sine wave, the maximum and minimum values are 160 times every second, and the values vary due to the detector noise. Therefore, the result is 20% or greater than the original value (40 mm/s2).
•Using the overall value of the spectrum
Using the same data as before, the Table 5 shows the result of calculating the half amplitude value from the overall value of the power spectrum obtained by FFT analysis. Since the length of the time-axis waveform data for one time of FFT is 1 second, the time-axis waveforms for 39 times of FFT can be cut out when analyzing with overlap amount of 50%. The half amplitude values shown for each measurement are the average of the 39 times measurement results.
Analysis condition:
-Frequency range, 8 kHz
-Sampling points, 1024
-Time window length, 50 ms
-Overlap amount, 50%
-DC cancellation, ON
Table 5. Half amplitude value from the overall value of the power spectrum
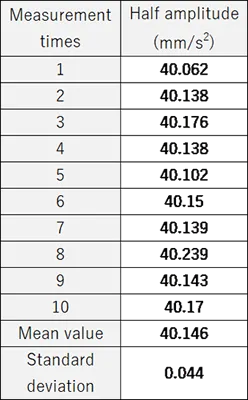
The mean value of 10 times measurement data is 40.146 mm/s2, the standard deviation is 0.044 m/s2. Since the overall value of the power spectrum is calculated by the square of the acceleration, it is less affected by the detector noise. When the amplitude of the acceleration signal is 40 mm/s2 and the amplitude of the noise is 4 mm/s2, the overall value of the combined signal of those is only √(402+42 )=40.2. If the signal is about 10 times greater than the noise, the result will be sufficiently accurate.
•Summary
In this column, I explained the measurement result for the detector noise of the accelerometer. It finds that the detector noise contains background noise and residual offset. From the data obtained by adding the sine wave to the detector noise, the amplitude of the sine wave was obtained by three methods. The effect of detector noise vary depending on the method of calculating the amplitude.
(Y·K)