No.43 Basic measurement setting procedure for FFT analysis with FFT analyzer
When performing frequency analysis using the FFT analyzer, many people are troubled about the procedure. This time, I will introduce the setting procedure of the FFT analyzer.
Measurement procedure using FFT analyzer
The most popular procedure is as follow:
1. Connect a sensor and set the input setting of a sensor
2. Set the various measurement setting to measure correctly the input waveform
3. Discretize analog signals to convert to digital signals
4. Divide into short time intervals (analysis flames)
5. Perform FFT calculation and draw the power spectrum
6. Perform averaging and save it as analysis result
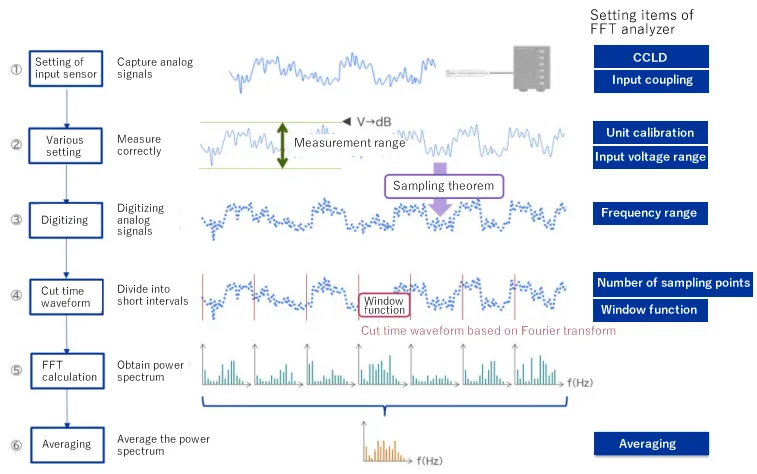
1. Connect a sensor and set the input setting of a sensor
The one of setting is CCLD (constant current drive) setting.
When using microphone with a built-in pre-amplifier or an accelerometer, it is necessary to supply current to the sensor from the FFT analyzer.
This setting enables the sensor to output the correct voltage signals.
2. Set the various measurement setting to measure correctly the input waveform
The one of setting is CCLD (constant current drive) setting.
The input voltage range should be set to monitor properly the input signals. In addition, perform the unit conversion to convert the input signals to sound or vibration signals. This is called the unit calibration.
Please refer to the operation manual for DS-3000 series.
https://www.onosokki.co.jp/English/hp_e/c_support/ope_manual/pdf/ds3000_np_calib_e.pdf
3. Discretize analog signals to convert to digital signals
The FFT analyzer processes the signals digitally. Therefore, it is necessary to digitize the analog input signals, which is called discretization (sampling). In particular, sampling in the time axis direction is called sampling, and sampling in the amplitude axis direction is called quantization. Sampling analog signals is based on the theorem called the "sampling theorem".
4. Divide into short time intervals (analysis flames)
When performing FFT with an FFT analyzer, only finite data can be calculated realistically. Therefore, the digital data discretized in the previous step is calculated by dividing it by a certain finite points (also called cutting by a time window). However, since it is cut at a certain point, the leakage error may occur. To reduce the leakage error, weighting is applied so that the beginning and the end of the cut time window become smoothly (zero). This is called window function. There are various types of time window, but it is common to be used a Hanning window for continuous sound and vibration.
5. Perform FFT calculation and draw the power spectrum
With the FFT analyzer, you can draw various FFT analysis graphs. Generally, the power spectrum graph is used to check the magnitude of each frequency component.
6. Perform averaging and save it as analysis result
Since the value of the power spectrum for each analysis frame varies from time to time, it is common to be used the power spectrum averaged for a certain analysis time or the number of analysis frames as the analysis result.
Summary
In this column, I have explained about the popular procedure of frequency analysis with FFT analyzer. There are many setting items for measurement in FFT analyzer: supply current to the sensor connected, convert the unit from voltage to dB, digitize the analog to digital signals, etc. Upon the measurement procedure understood, make settings according to each step with the FFT analyzer.
(MO)