No.40 How to obtain the average of sound pressure level for the specific interval in OS-2000 series Basic?
The situation this time is as follow:
- the sound pressure data (unit: Pa) applied A-weighting is recorded as a WAV file.
- to obtain the average of sound pressure level for the specific interval
- OS-2000 series Basic is installed.
The 1/N Octave analysis and FFT analysis functions are not included in the OS-2000 Basic.
These functions enable to obtain the average value to display the average graph.
Then, how can we obtain the averaged sound pressure level in OS-2000 Basic?
There are two methods as follow:
1. the method to obtain the standard deviation value (or effective value) of the statistical processing function
2. the method to obtain the result of the effective value calculation of signal processing
1. The statistical processing function
Specify the range in advance for which you want to obtain the average value.
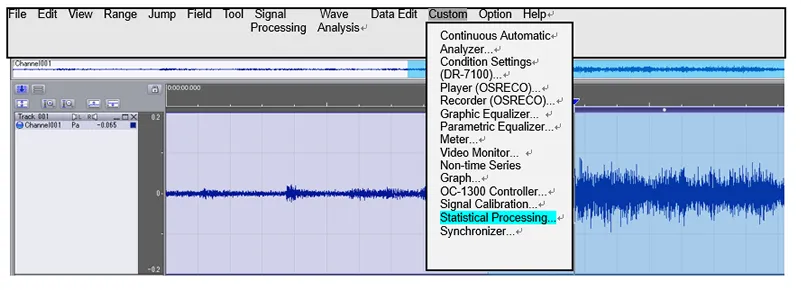
Open Menu → Custom → Statistical processing.
Click “Statistical processing” to execute.
Use the “Standard deviation” in the calculated value displayed
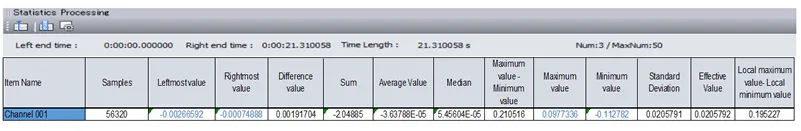
Standard deviation:Square root of the average of the square of the variance between the individual data and the average data in the interval.
RMS value:Square root of the average of the individual data in the interval.
The reason why not using RMS value: In the Sound pressure level value, the DC component (average value) is cut. If the average value of the data deviates from 0 (there is an offset for DC), use the standard deviation that subtracts the average value to obtain the sum of squares.
Standard deviation: 0.0205791
Sound pressure level: 20 x (0.0205791 / 0.00002)= 60.248 dB
*0.00002 (20μPa) is the reference sound pressure (0 dB).
2. The effective value calculation
In the efficient value calculation of signal processing, the instantaneous sound pressure level is obtained. However, the average value within the interval cannot be obtained. Save the instantaneous sound pressure level in text format and use Excel to calculate the average value.
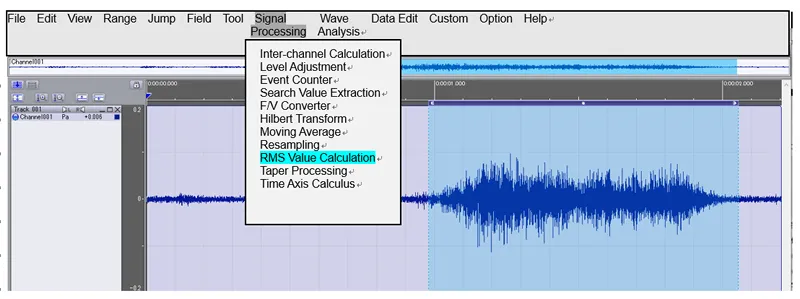
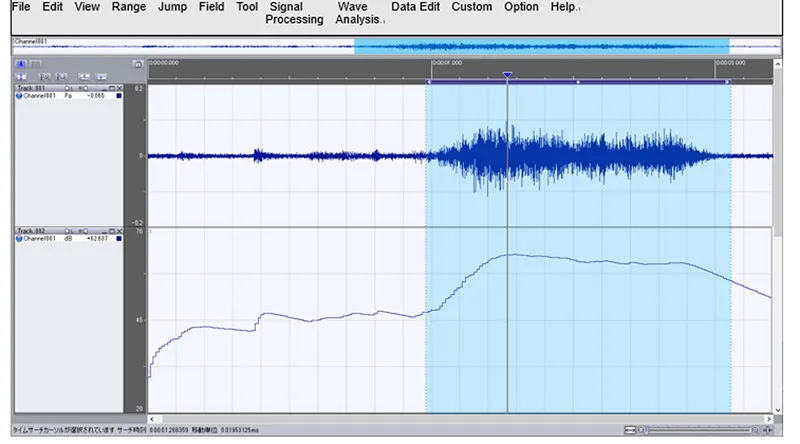
Open Menu → Signal processing → Effective value calculation
Select the “entire interval” in the interval.
As for specifying the interval, it will be specified when exporting to a text file later.
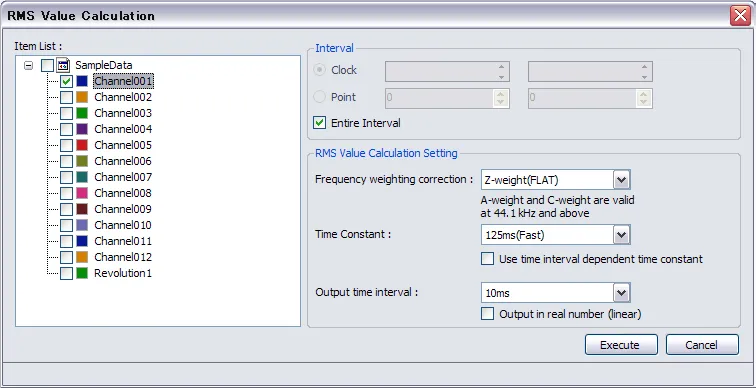
The frequency weighting correction is “FLAT”. The A-weighting is applied to the sound waveform.
The time waveform of effective value is obtained.
Save it as text format. File → Export data file → CSV file
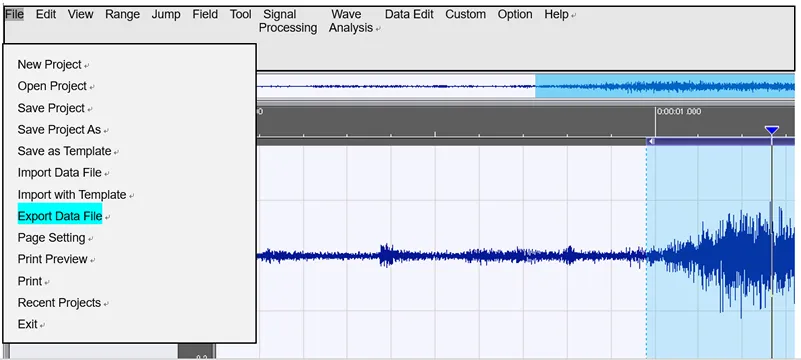
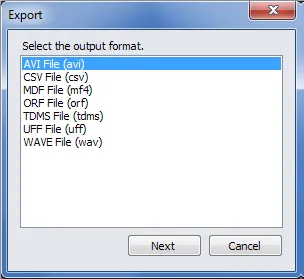
Select the file and execute.
The file to be exported is not the original waveform but the effective value data file.
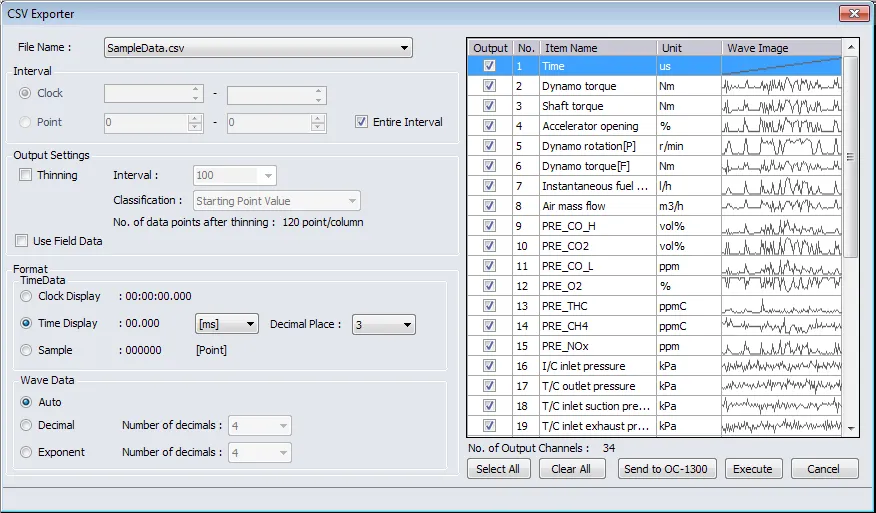
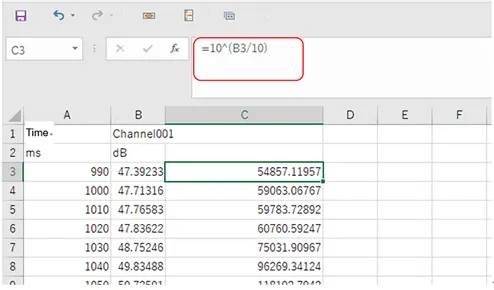
Once CSV file is made, open it in Excel.
Convert a dB value to a squared value. (Equation is 10^(dB value/10).
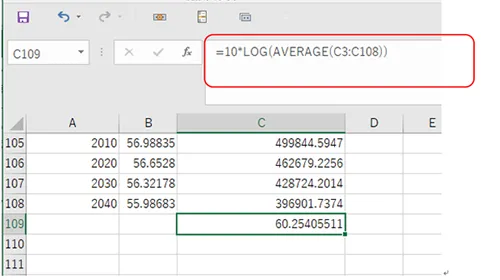
Calculate the average value of the squared value and convert it back to the dB value.
10 x LOG (the average value of the squared value) = 60.254 dB
The average value is obtained by two methods.
If you want to be the average value of the A-weighing sound waveform, use the efficient value calculation method, select A-weighting in the frequency weighting.
Since A-weighting is not applied to the sound pressure waveform, it cannot be obtained from the standard deviation in the statistical processing.
(HK)