No.4 Measurement of frequency response function using sweep signals
In this column, I will talk about the measurement of frequency response function using sweep signals, etc.
To measure the natural vibration frequency, there is a method of vibrating the object with an exciter and obtaining the frequency response function, or measuring the frequency response function of filters.
Here are some of the input signals used for measuring the frequency response function.
●Frequency response function and FFT
The frequency response function is a function of frequency and has a complex value. Since it is a complex number, it has a real and an imaginary number. Alternatively, it may also be expressed in terms of gain (amplitude) and phase. When a sine wave with amplitude, 1 at certain frequency is input to an object, the amplitude of the signal output from the object is called "gain". The time differences of the output signal is called "phase". If there is a time lag, the phase will be a negative value.
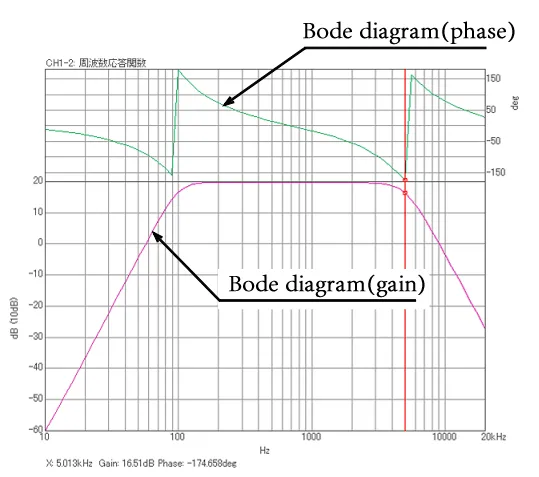
Fig.1 Example of Frequency response function
To measure the frequency response function, input the sine wave with certain frequency, measure the output sine wave, and obtain the amplitude ratio and phase difference. By repeating the same measurement by changing the frequency of the input sine wave, the frequency response function can be obtained. Signals whose frequency change one after another are called sine sweep signals.
If you input signals with wide band frequency components, measure the output signals, and perform FFT for each of them to obtain the frequency spectrum, you can obtain the frequency response function. The signals used in such cases are random signals, swept-sign signals, and pseudo random signals. Theoretically, the frequency response function can be obtained by performing the FFT calculation once. However, in fact, by performing multiple FFT calculations and averaging them, it is obtained to improve the measurement accuracy.
●Signals for measuring frequency response function
Here are some of the signals for measuring the frequency response function. In particular, the sine sweep signal and the swept sine signal are often confused, however, they should be clearly distinguished when measuring the frequency response function.
(1) Sine sweep signal
Figure 2-1 shows an example of the sine sweep signal when measuring the frequency response function using the FFT method. This example is the first 10 seconds of the waveform, which has a frequency range of 1 kHz and sampling points of 2048, when sweeping from 5 Hz to 50 Hz. The analyzer outputs 5 Hz of sine wave for 0. 8 seconds to measure frequency response function. The same process repeats with 6.25 Hz, 7.5 Hz ... and up to 50 Hz of sine waves. Since there are 37 lines, it takes 0.8 seconds x 37 = 29.7 seconds to measure. It takes more time to perform multiple FFT calculations for one frequency component and average them. In this way, it takes some time to measure the frequency response function by the FFT method using the sine sweep signal.
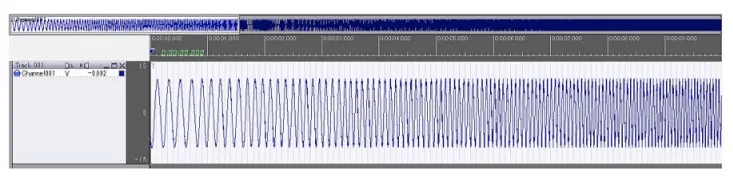
Fig.2-1 Time-axis waveform of the sine sweep signal (partially)
(2) Random signal
A signal generated by a random number is called a random signal. The signal called white noise among random signals will have the same amplitude for all frequency components when averaging them for long period. Figure 2-2 shows the time waveform and spectrum of a random signal with frequency range of 1 kHz and sampling points of 2048.
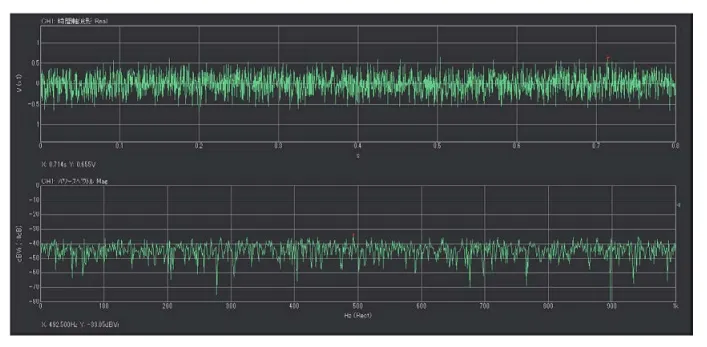
Fig.2-2 Time-axis waveform and power spectrum of the random signal
(3) Swept sine signal
A sine sweep signal is a sine wave whose frequency changes over several tens of seconds, while a swept sine signal is a sine wave whose frequency changes from 0 Hz to the upper range frequency within the time length of one time FFT calculation. Figure 2-2 shows the time waveform and spectrum of a swept sine signal with frequency range of 1 kHz and sampling points of 2048. The swept sine signal in Figure 2-2 changes frequency from 0 Hz to 1 kHz for 0.8 seconds.
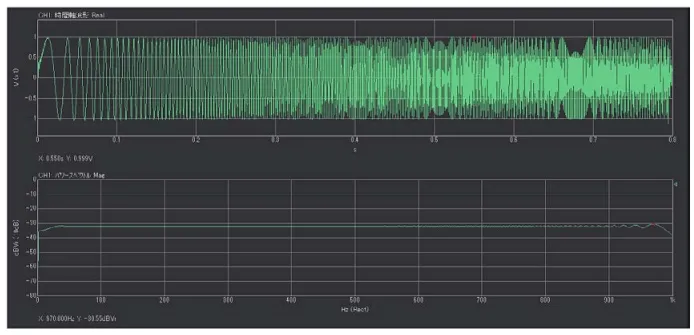
Fig.2-3 Time-axis waveform and power spectrum of swept sine signal
(4) Pseudo random signal
A pseudo random signal is a seemingly random signal, but it is the sum of sine waves of each frequency with the same amplitude and random phase, and its spectrum is flat.
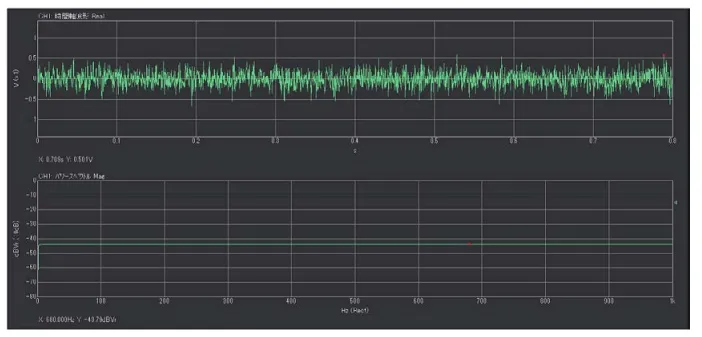
Fig.2-4 Time-axis waveform and power spectrum of pseudo random signal
●Summary
I have explained about some signals used for measuring the frequency response function. The time required for measurement differs greatly between measurements using sine sweep signals and wideband signals (random signals, swept sine signals, pseudo random signals). The setting of measurement using sine sweep signals is more completed. Therefore, I will explain the setting, measurement procedure and precautions for using the sine sweep signal next time.
(Y·K)