No.37 Can extract the fluctuation frequency of sound by performing 1/3 octave analysis?
There is an abnormal sound generated from a motor or a gear whose magnitude is repeated periodically. It is common to extract the magnitude of the repeated frequency components by extracting envelope and performing FFT analysis in order to find their characteristics.
This time, we will perform 1/3 octave analysis and extract the repeated frequency components from the magnitude of the fluctuation of sound pressure level.
The following example shows extracting fluctuation components by performing 1/3 Octave analysis of the waveform with repeating frequency components.
Original waveforms:
- the signal with 2000 Hz of frequency , 10 Hz of fluctuation frequency
- the signal with 5000 Hz of frequency , 30 Hz of fluctuation frequency
- the random signal
Add these three signals to create a composite waveform
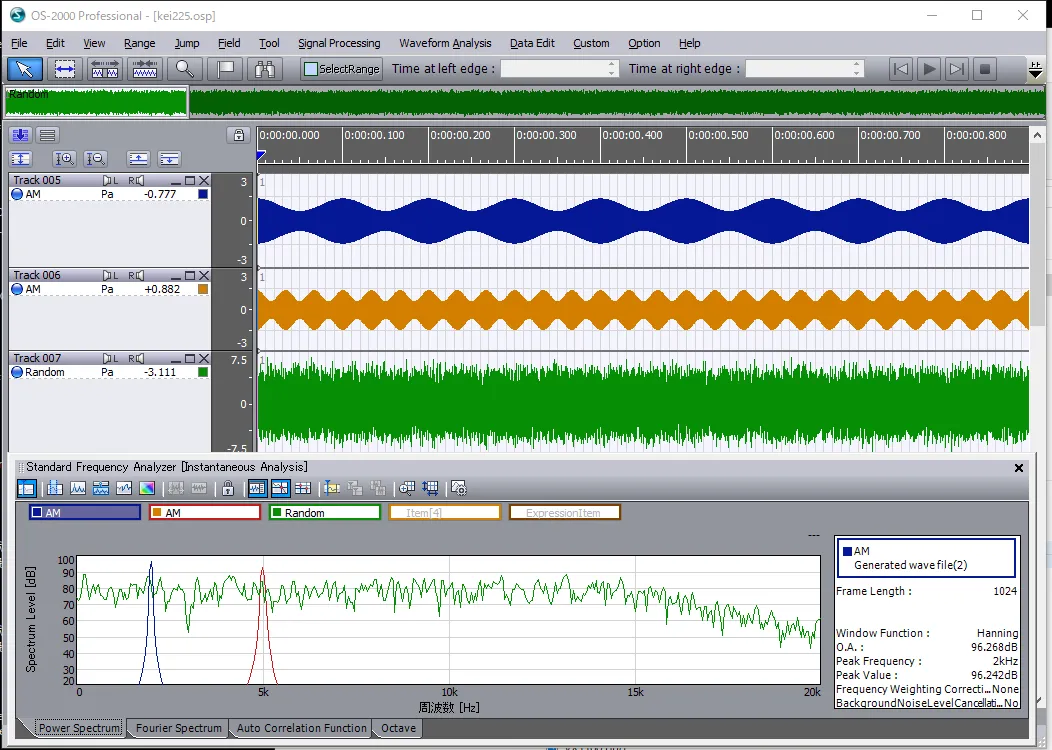
It cannot be clearly seen from the composite waveform (purple one) in the figure below if there are repeating frequencies or not.
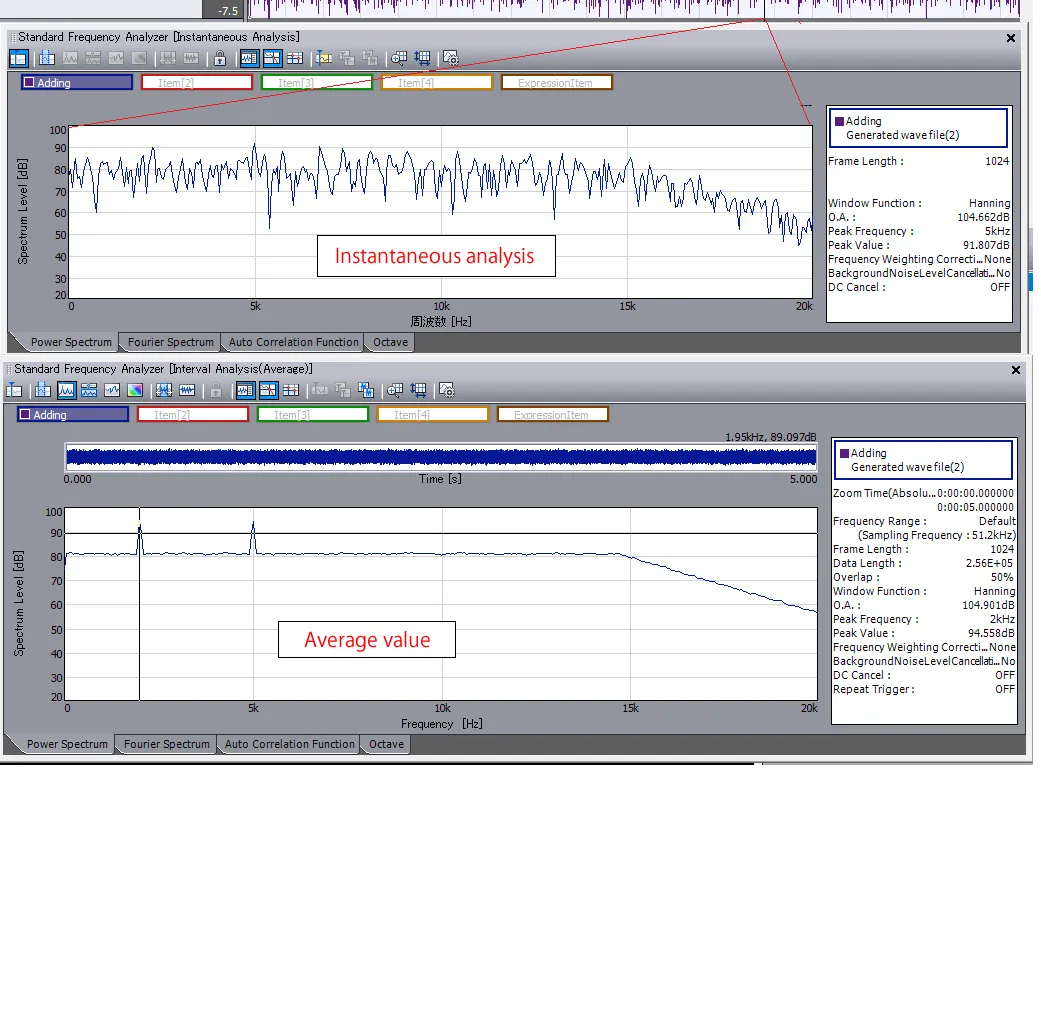
Perform FFT analysis of the composite waveform to see its power spectrum.
The peaks can be seen at 2000 Hz and 5000 Hz, which means the frequency components of 2000 Hz and 5000 Hz are greater than other frequency.
However, it cannot be seen how much the magnitude of peaks is fluctuating.
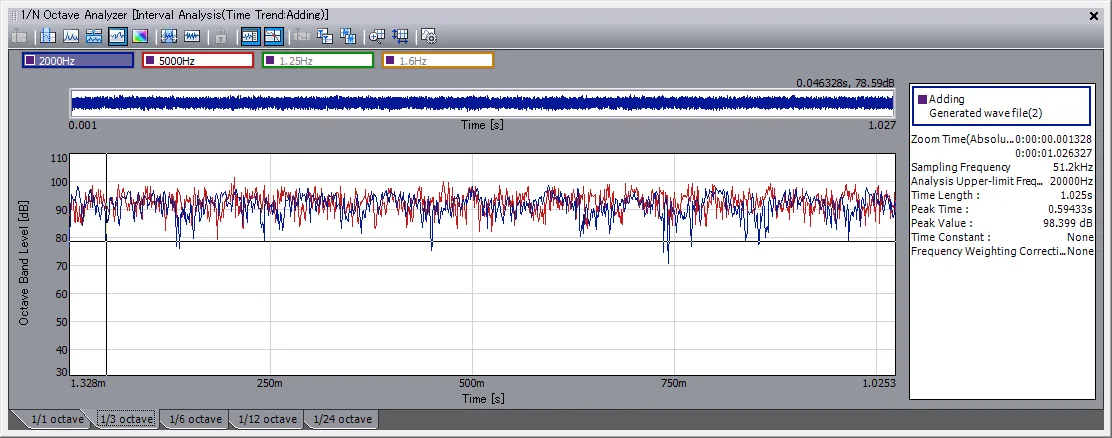
Perform 1/3 Octave analysis of the composite waveform. Select Time constant: None, analysis interval: 1 ms. Note that if time constant is applied, the fluctuation will be averaged and cannot be seen.
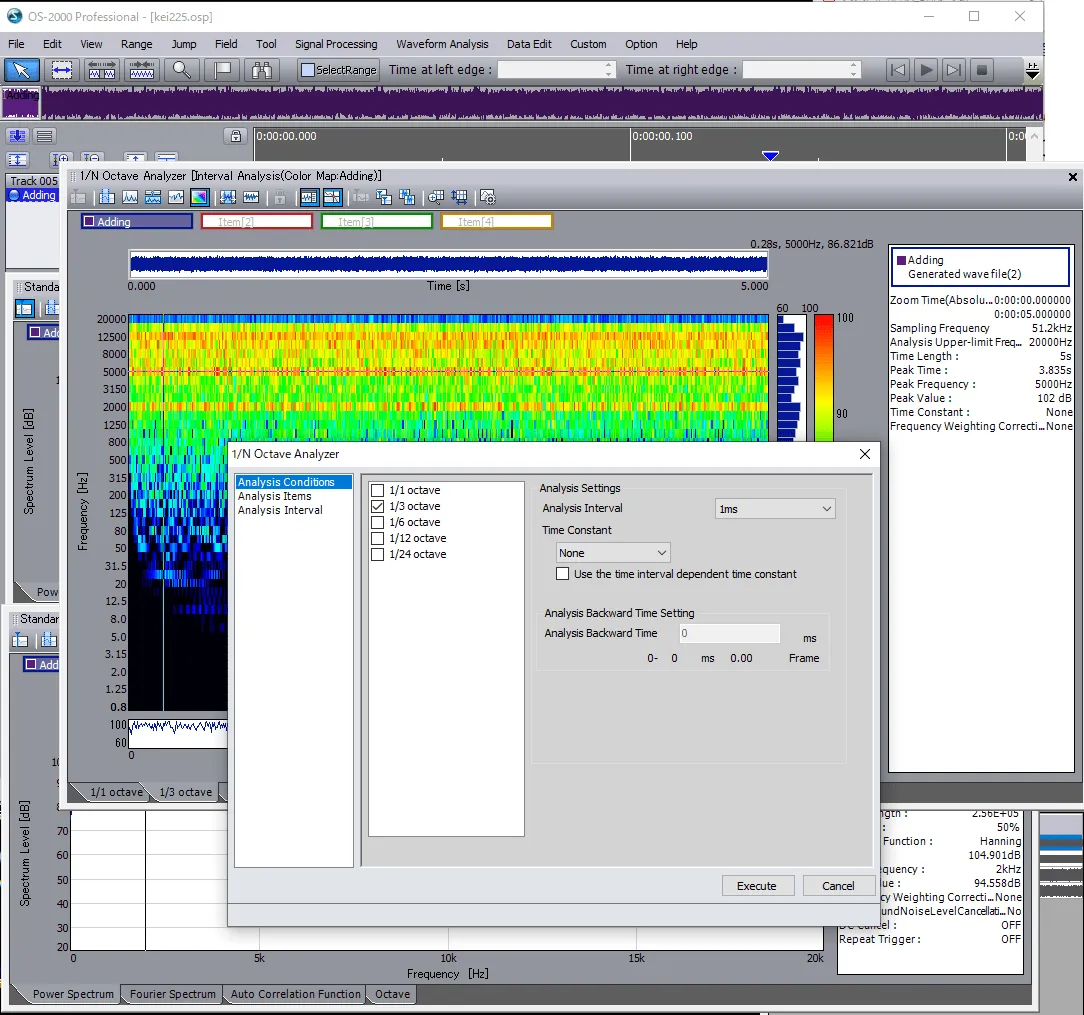
The magnitude change periodically in the color pattern of 2000 Hz and 5000 Hz. Check by changing the color scale adjustment (95 -60).
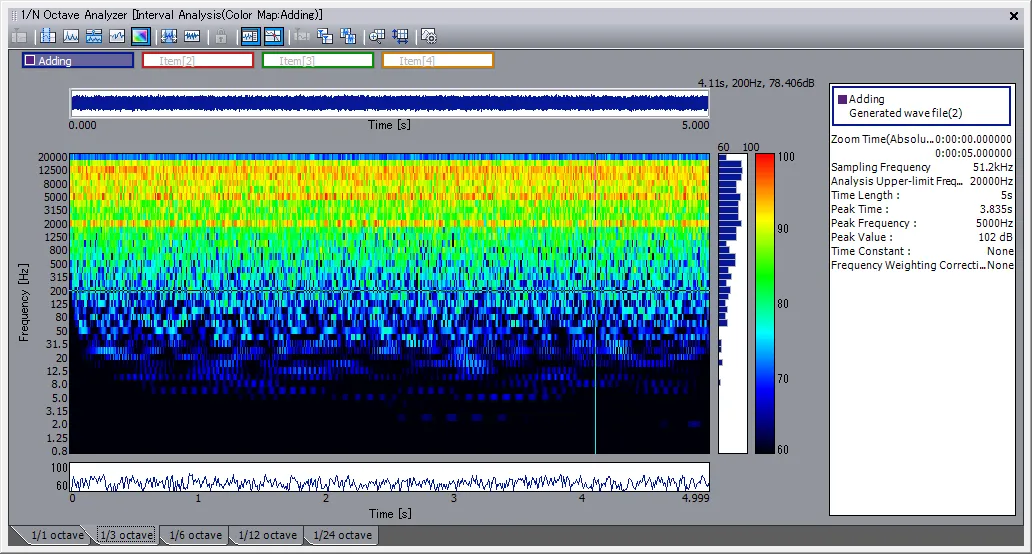
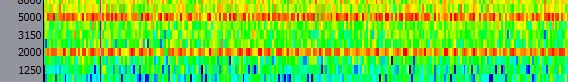
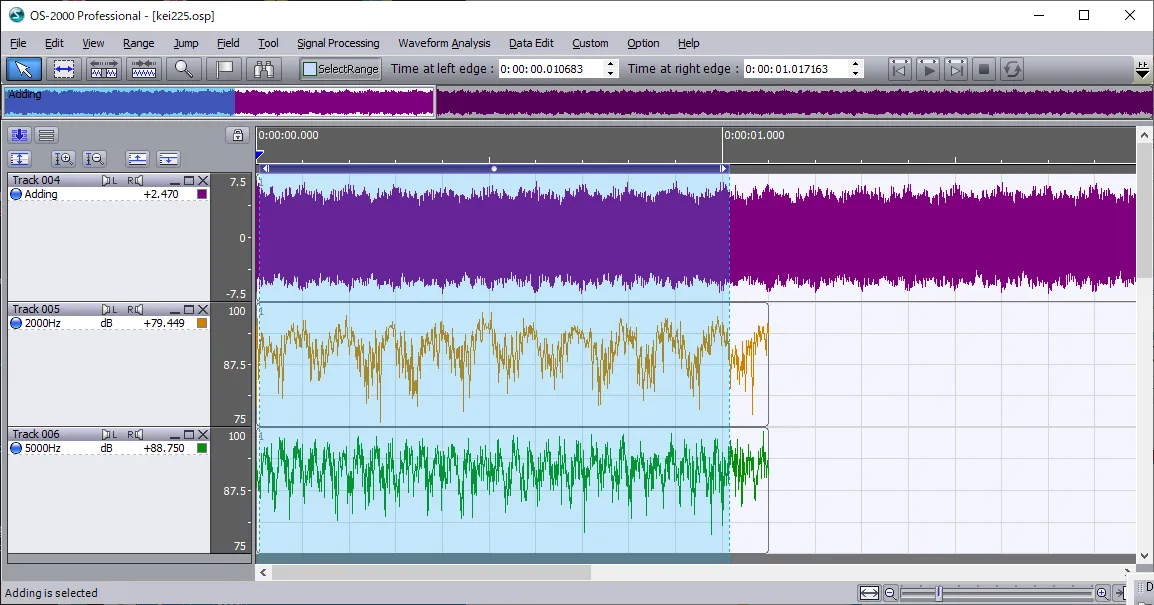
There are color changing repeatedly at 2000 Hz and 5000 Hz. Look at the time trend of 2000 Hz and 5000 Hz. The time trend is for 1 second.
There are changes between 80 dB and 95 dB.
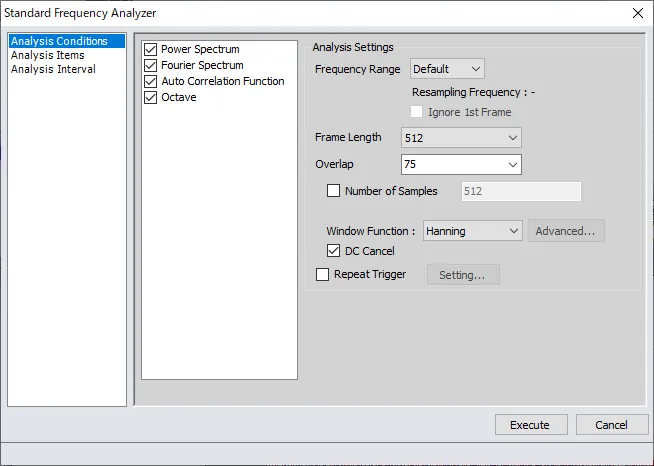
Perform FFT analysis of the time trend waveform of 2000 Hz and 5000 Hz. Save the trend data as CSF format and right-click a mouse on the screen.
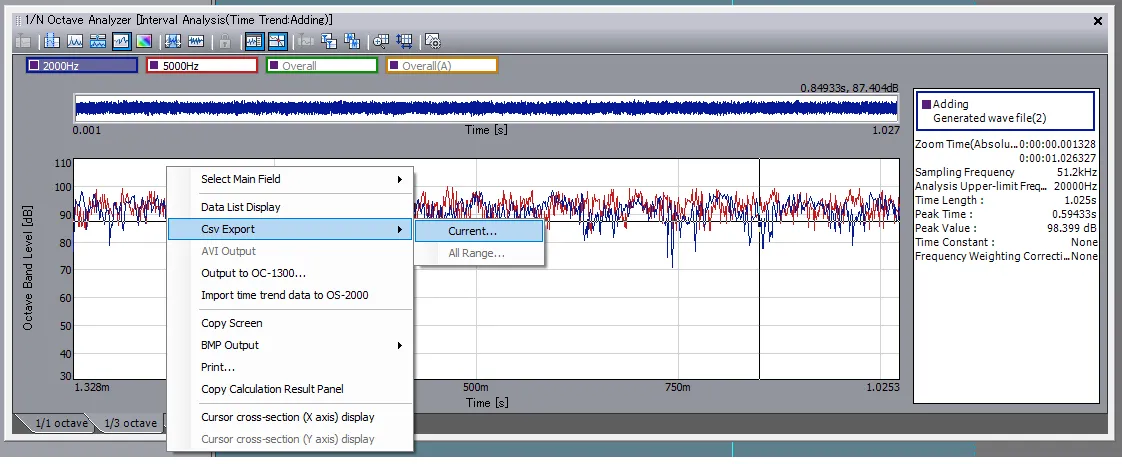
Import the saved CSV file as the ASCII file.
The sampling frequency is 1000 Hz since the 1/3 octave is obtained every 1 ms.
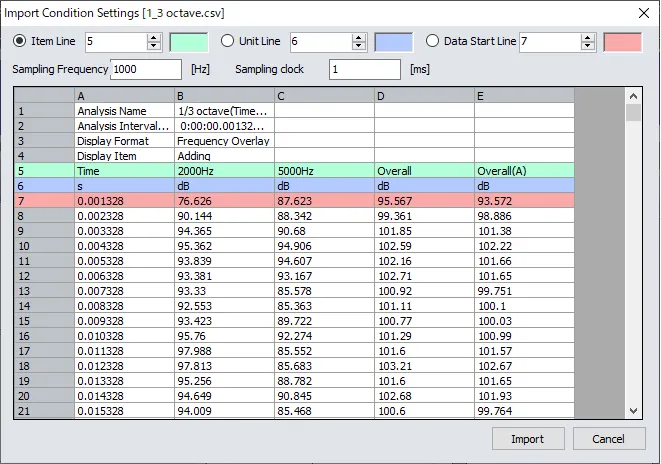
The file is added into Data Manager once imported.
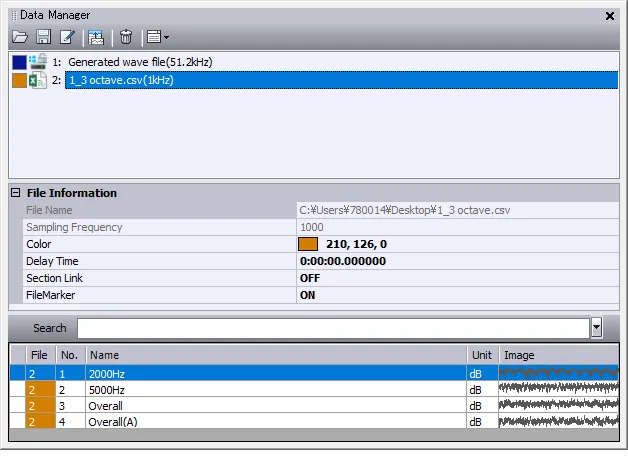
Track5 for 2000 Hz, Track6 for 5000 Hz of trend waveform
Perform FFT analysis. Since the measured data has 1 s of interval, 1000 Hz of sampling frequency, the frame length should be longer.
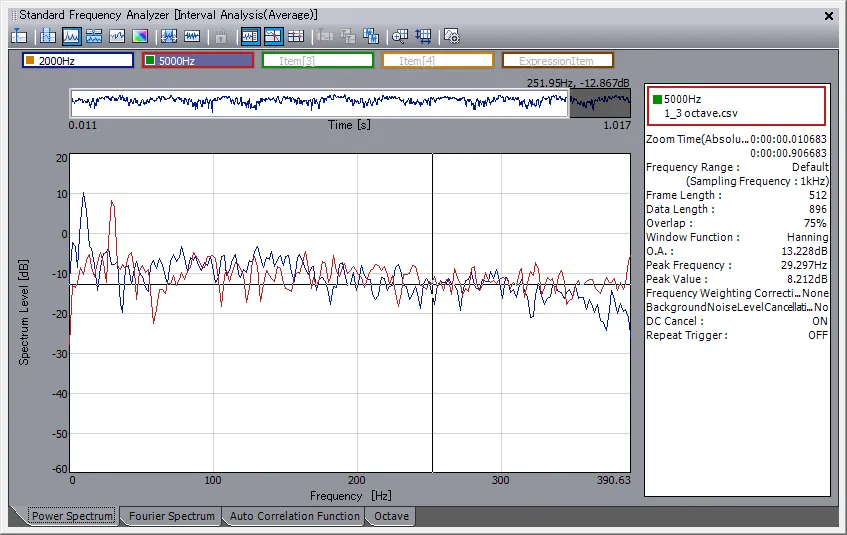
There are peaks at 10 Hz and 30 Hz, which means the trend waveforms of 2000 and 5000 Hz have the repeated fluctuating components.
If you feel that sound is repeatedly changing, you can find the fluctuating frequency by performing 1/ 3 octave analysis, searching for the changes with a color pattern and performing FFT analysis of the trend waveform.
(HK)