No.33 How to use DS-3000 series RecordFileViewer?
In this column, we explain how to use RecordFileViewer which is software to display or edit the waveform of offline analysis data.
•Display screen and operation of Sound and Vibration Real-time Analysis software DS-0320
Displaying DS-0320 as in Figure 1.
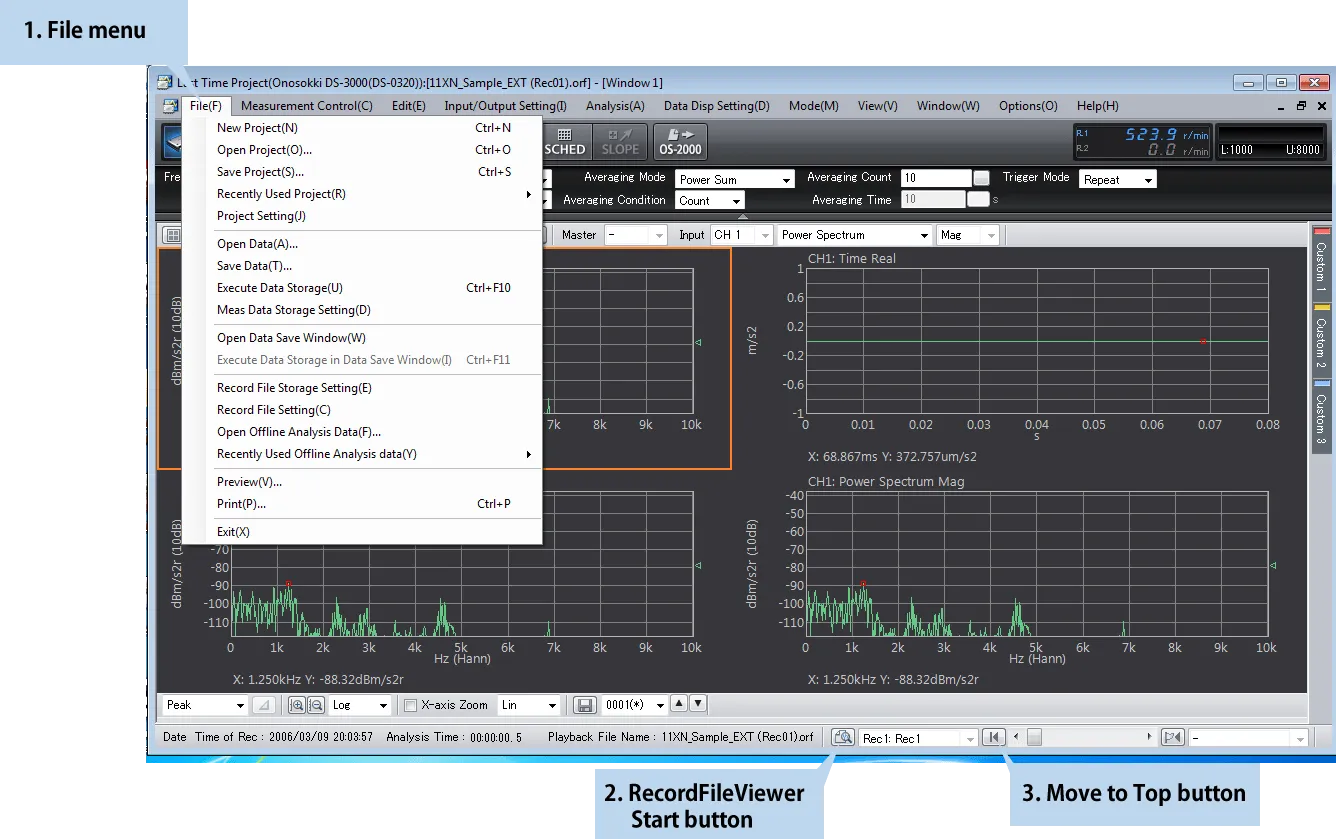
Fig.1 Screen of Sound and Vibration Real-time Analysis software DS-0320
1. File menu
When performing offline analysis of record data such as ORF format recorded by the same software or exporting record data to a text file / WAV file, open from “Open Offline Analysis Data” in the file menu.
2. Start button of Record File Viewer
Click “RecordFileViewer start button” on offline analysis control toolbar to open RecordFileViewer window.
3. Move to Top button
If you want to perform the offline analysis again from the beginning of record data, click “Move to the Top button” on the offline analysis control toolbar.
•Display screen and operation of RecordFileViewer
The screen of RecordFileViewer is shown in Figure 2. 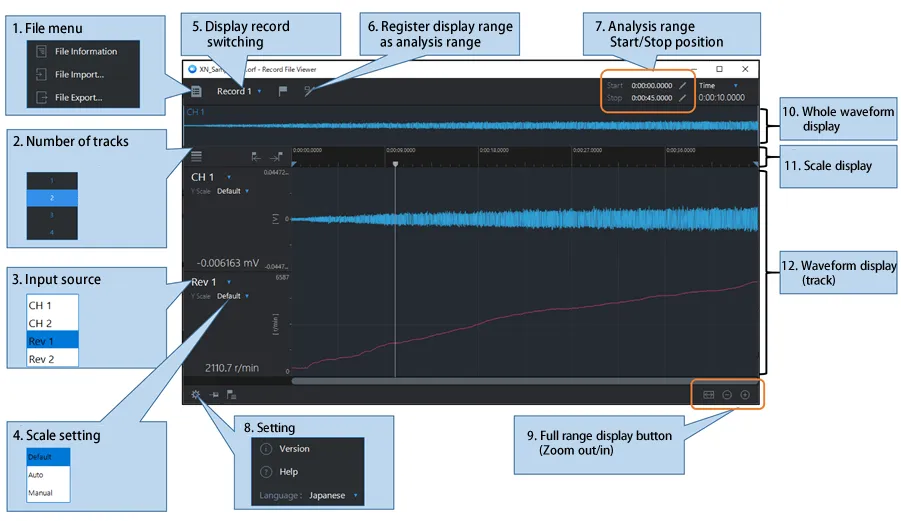
Fig. 2 Screen of Record File Viewer
1. File control
Open file control menu. When exporting record data into text file/WAV file, execute “File Export”. If you would like to export record data partially, execute “File Export” after specifying the analysis range as mentioned later.
2. Number of tracks
Select the number of tracks to be displayed in waveform display.
3. Input source
Select the channel to be displayed each track
4. Scale setting
Set the display scale.
5. Display record switching
Some record results can be recorded in a record file. When repeating START/STOP a few times while pressing REC button of DS-0320, some record will be recorded in the file. Thus, you may select the record to be displayed by switching display record.
6. Register the display range as the analysis range
Register current display range as analysis range.
7. Start/Stop position of analysis (analysis range)
The analysis range will be displayed. Numerical value (time, minute, second) in the text box can be directly edited. Clicking
 on each Start/Stop, the cursor position will be set as Start/Stop.
8. Setting
Open the setting menu. You may confirm the version of RecordFileViewer and on-line help can be displayed. Also the language displayed on tool tips can be selected.
9. Full range display button (zoom out/zoom in)
By clicking full range display button, then the full range of the selected record will be displayed. The display range can be zoomed in and out by clicking zoom in/out button.
10. Whole waveform display
Whole time waveform range of the selected record will be displayed.
11. Scale display
Time scale (hh:mm:ss), analysis range and cursor position mark are displayed.
12. Waveform display
Time waveform of the channel selected in Fig.2 3 will be displayed. Clicking mouse button somewhere in waveform display, the cursor will be moved to there. Dragging mouse from left to right, the dragged range will be zoomed in. Dragging mouse from right to left, the dragged range will be zoomed out.
•Specifying analysis range
The procedure of specifying analysis range in Record File Viewer is shown as follow. If you would like to export record data partially, execute “File Export” in file menu (Fig.2 1) after specifying the analysis range as follow.
(1) If analysis range (start/stop position) is fixed, input time (hh:mm:ss) in text box (Fig.2 7).
(2) If selecting full record data as analysis range, after clicking full display button (Fig.2 9), clicking “Register the display range as the analysis range” (Fig.2 6).
(3) If setting the cursor position as analysis range, clicking
of start/stop in Fig.2 7.(4) By dragging start position mark (
 ), stop position mark (
 ) in Fig.2 11 toward right or left , start/stop position can be shifted.
•Summary
We’ve briefly explained about RecordFileViewer in this column.For details on basic operation procedures and menu commands in RecordFileViewer, refer to Help incorporated in RecordFileViewer.
You can access Help by clicking the “Help” command from the menu expanded (Fig.2 8).
(YK)