No.3 Measuring with an impulse hammer and its tips
In this column, I will talk about topics related to hammering measurement with impulse hammers.
Impulse hammers come with several types of tips. Generally, a hard tip is used when measuring more high frequency band, and a soft tip is used when measuring lower frequency. This time, I will introduce the time axis waveform and power spectrum when hitting with each chip, and explain why it is necessary to use different tips accordingly.
●Time waveform and power spectrum of hitting force by an impulse hammer
The figure 1 shows the time waveform, the figure 2 shows the power spectrum. The yellow line is when using a medium tip (plastic), the red line is when using a super soft tip. These waveforms are measured in a frequency range of 20 kHz and sample points of 8192, and the X-axis is enlarged.
The maximum force is about 96 N for the medium tip and about 29 N for the super soft tip, which found that using a hard tip generates stronger force. From the power spectrum, it can be seen that the frequency component extends up to about 1100 Hz on the medium tip (yellow) and up to about 290 Hz on the super soft tip (red).
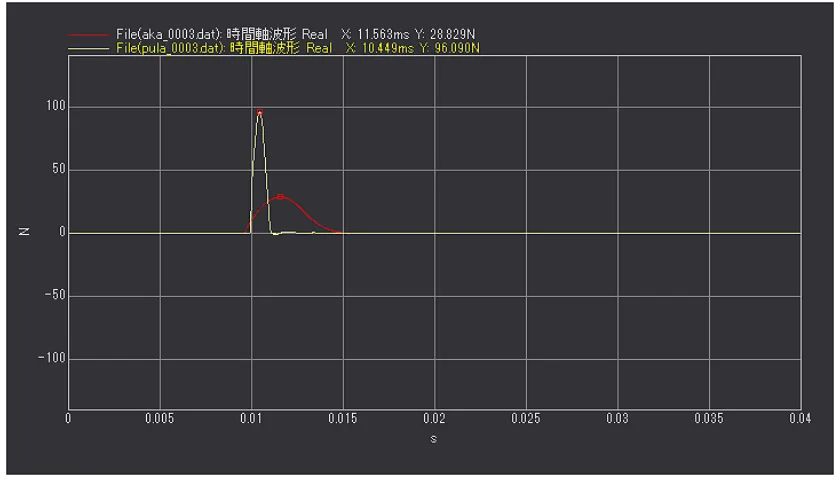
Fig.1 Time waveform (yellow: medium tip, red: super soft tip)
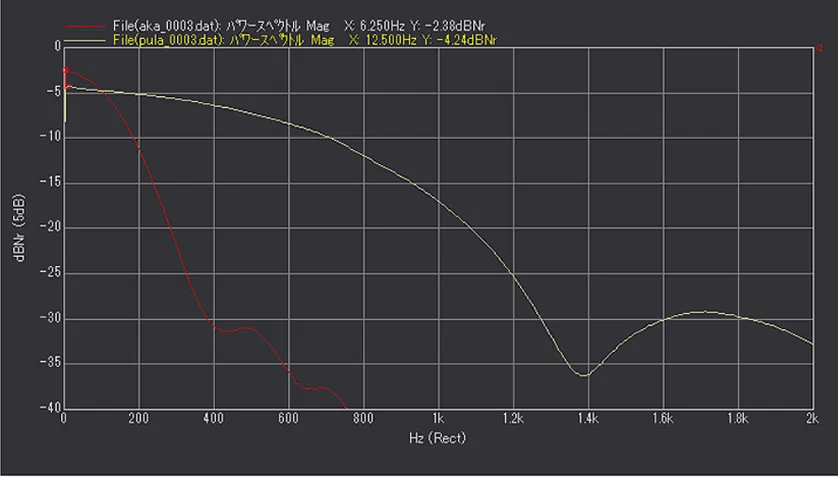
Fig.2 Power spectrum (yellow: medium tip, red: super soft tip)
●Time waveform and frequency band
When measuring the frequency response function or natural frequency by hammering, select the impulse hammer tips according to the frequency band. Even if the same tip is used, the power spectrum of the hitting force will change depending on the material of the object. Thus, hit the object and check the power spectrum, coherence function, and frequency response function each times. If the power spectrum of the hitting force does not extend to the frequency band to be measured, or if the coherence function is low, change to a harder tip.
On the other hand, if the frequency extends to a higher than the expected one, the S/N of the band will be lower due to the high frequency component, and it will be difficult to adjust the trigger detection level for the following reasons. Therefore, use a softer chip.
The FFT analyzer applies a low-pass filter that cuts frequency components higher than the frequency range included in the time-axis waveform when the frequency range is lowered. Thus, if you measure the time-axis waveform with high frequency components in the low frequency range, the time-axis waveform will be displayed lower than the actual one.
The waveform with a low-pass filter applied is shown in Figure 3 (medium tip) and 4 (super soft tip).
The maximum value of the time axis waveform (Fig. 3) of the medium tip are as follow; 96.1 N for the original waveform, 95.6 N for 2000 Hz, 64.9 N for 500 Hz, and 29.1 N for 200 Hz. It found that the amplitude decreases when a low-pass filter is applied (cutting high frequency components). The trigger detection level must be readjusted each time the frequency range is changed, as the S / N will be lower and the amplitude will be smaller.
The maximum value of the time axis waveform (Fig. 4) of the super soft tip are as follow; 28.8 N for the original waveform, 28.8 N for 2000 Hz, 29.2 N for 500 Hz, and 26.0 N for 200 Hz. It has a frequency component only about 290 Hz, thus the amplitude does not change even if a low-pass filter is applied. Further, there is no need to readjust the trigger detection level even if the frequency range is changed.
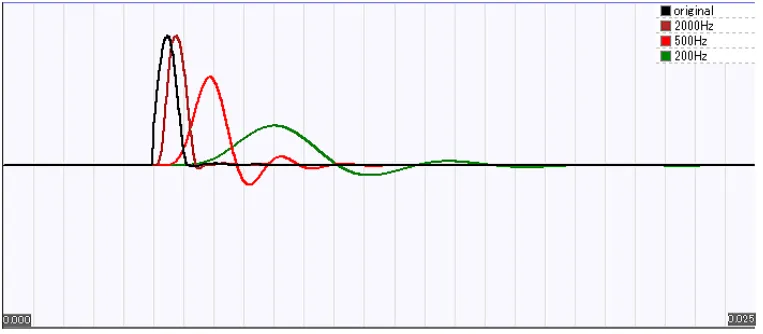
Fig.3 The waveform of hitting with the medium tip
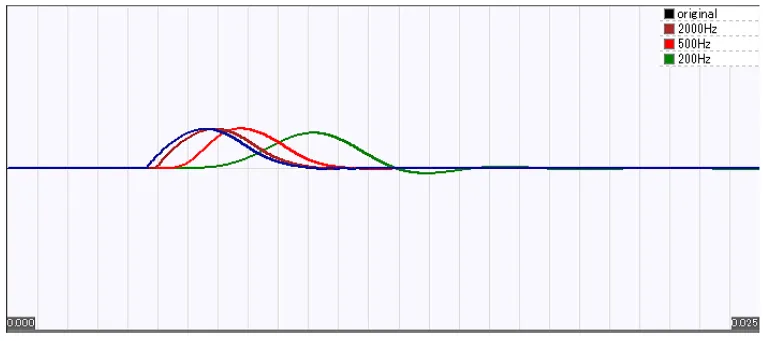
Fig.4 The waveform of hitting with the super soft tip
●Summary
HIn this column, I explained the time axis waveform, the power spectrum of the hitting force when using two types of impulse hammer tips with different hardness (medium and super soft), and the time waveform when a low-pass filter is applied to them. If a hard tip is used when measuring in the low frequency band, the S/N of the measurement result will be lower and it will be difficult to adjust the trigger detection level. Therefore, it is important to select the tip to match the frequency band to be measured.
(Y·K)